Join Our Telegram channel to stay up to date on breaking news coverage
Today, odds are we might see higher highs after 10 days of horizontal and price inactivity. Therefore, following 90+ percent drops from 2017 highs, IOTUSD, EOSUSD, LTCUSD and TRXUSD could print higher by end of week.
Let’s have a look at these charts:
EOS/USD: EOS Price Analysis
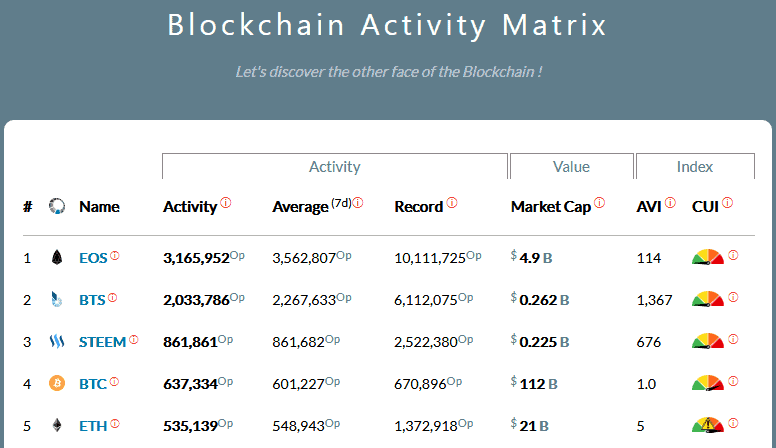
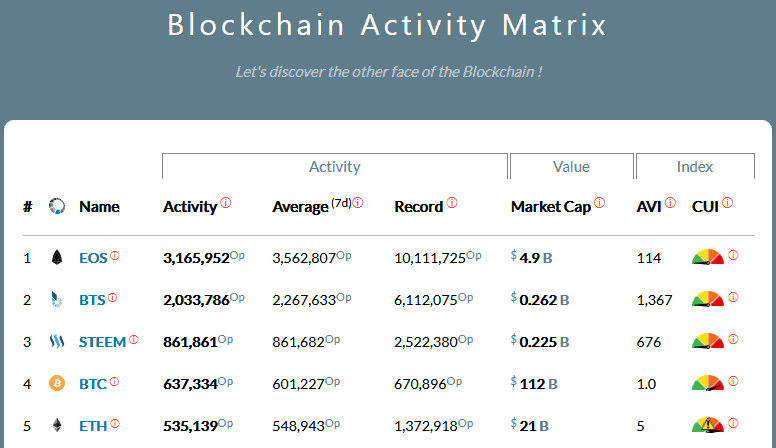
Even with “unacceptably” low trading volumes and thin order books, blockchain adoption is spreading. We can gauge this high level of adoption by the number of blockchain transactions of the top five crypto platforms. Most unexpectedly, this spike in market activity is printing in a deep bear market.
Of course the figure could be higher. Besides, rising coin prices would undoubtedly fuel more on chain activities. According to Blockctivity, EOS is now the most active platform in the last 24 hours.
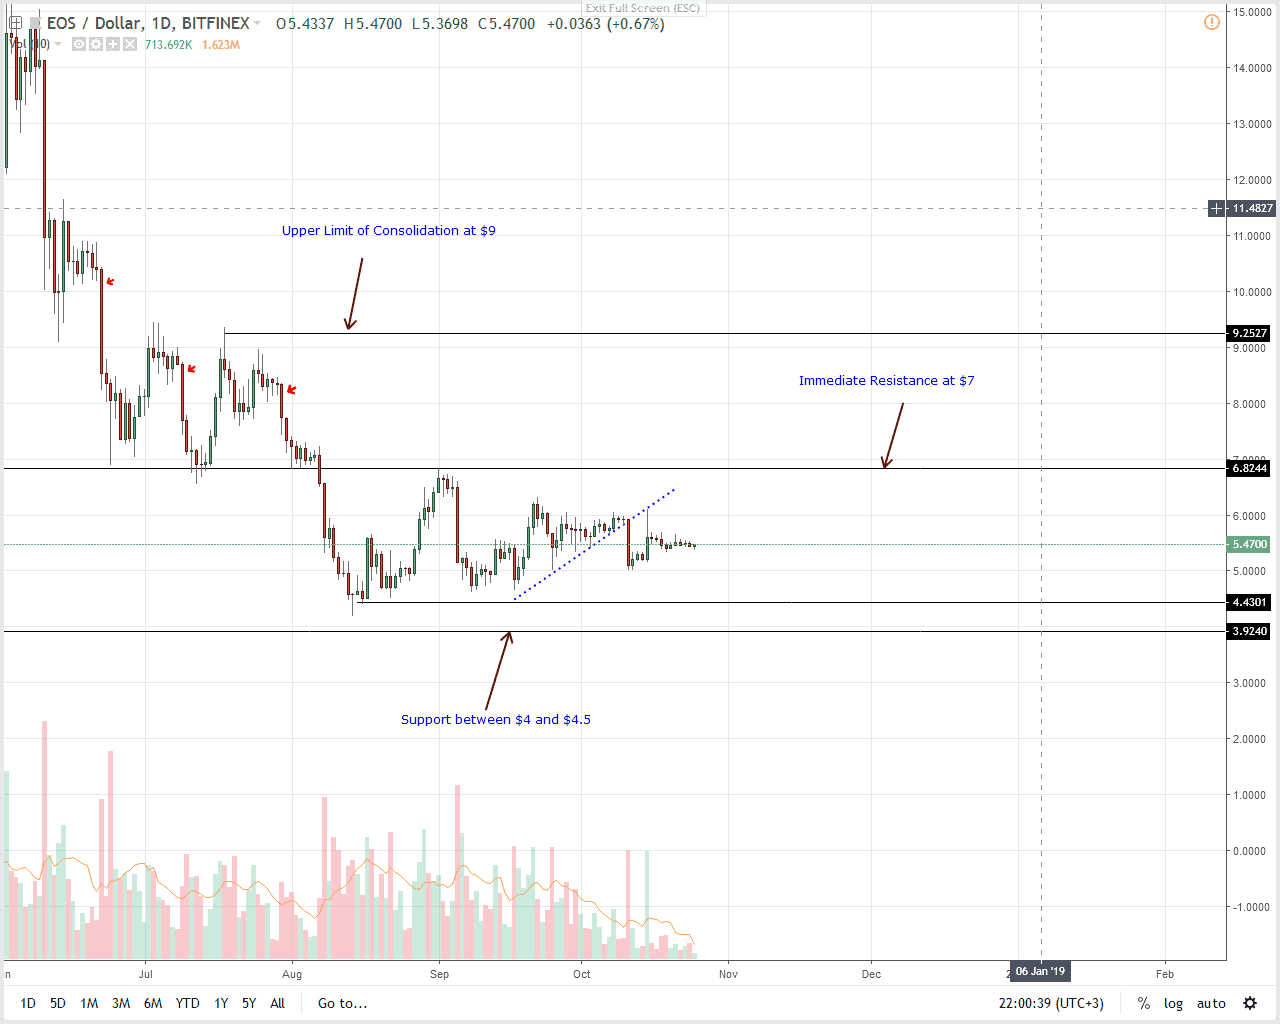
Price wise, EOS is stable and with increasing demand in lower time frames, we could see a shift of momentum as EOS bottom up. Notice that our previous trade plan is valid as long as prices are trading above $4.5, our main support trend line. Like in our last EOS trade plan, we remain expectant of gains and once there are encouraging moves above $7, EOS bulls would be free to snap up the coin on dips with first targets at $9 or higher depending on momentum.
LTC/USD: Litecoin Price Analysis
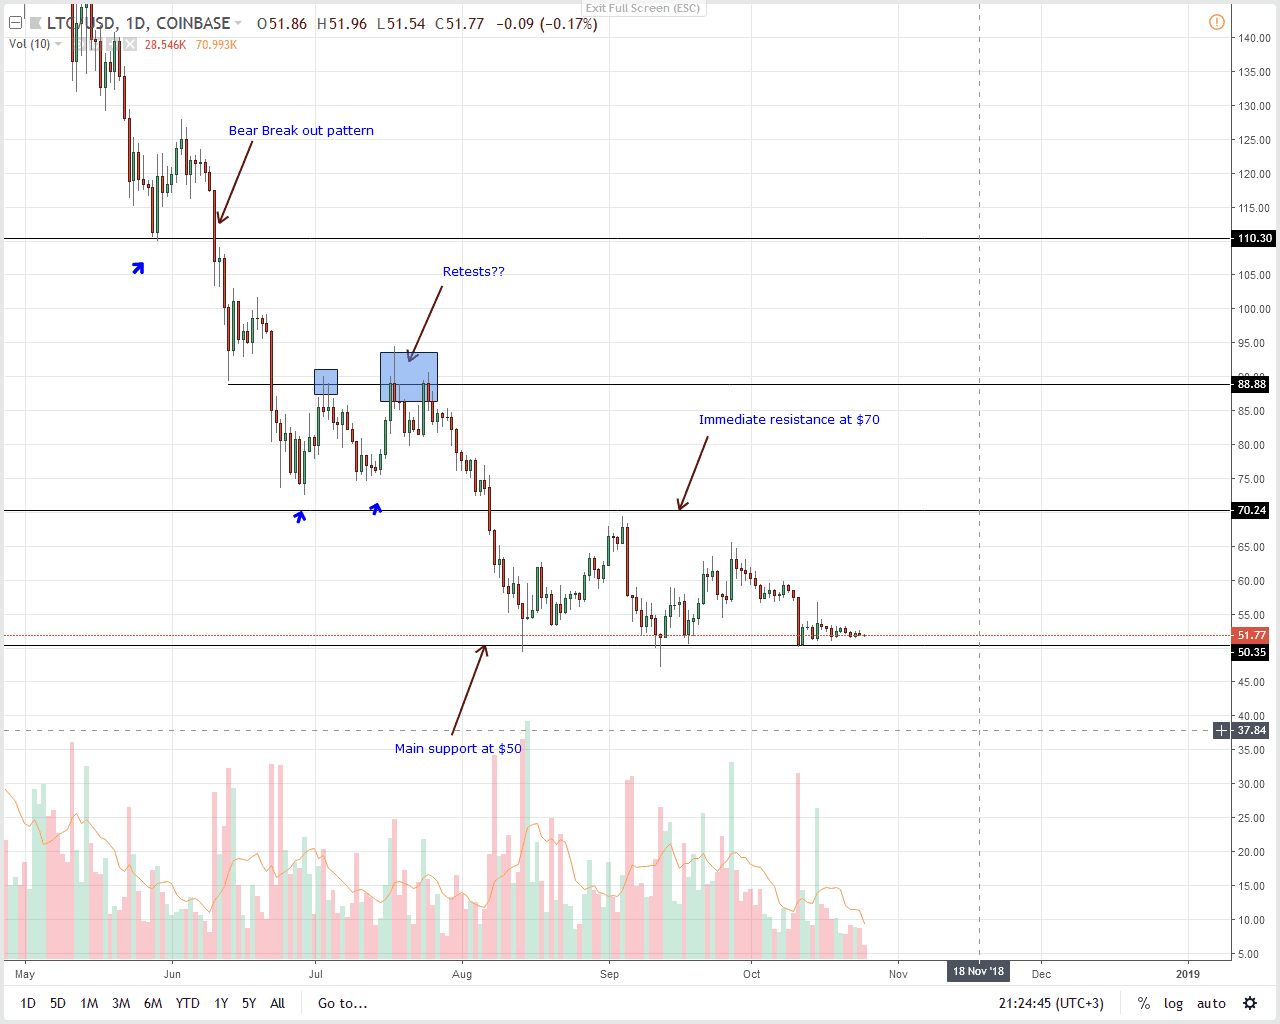
Still, Litecoin momentum and price is tapering with no discernible volatility between the weekly and daily charts. But, that has been the situation in the last couple of weeks and as long as prices are oscillating inside Oct 11 high low, bears have an upper hand. However, recent shift of demand and the fact that LTC is down 80 percent from 2017 highs could give bulls a chance to kick-start the market wide reversal.
For that to happen and as laid out in our previous LTC trade plan, bulls must build enough momentum and steer prices above $70 triggering buys with first targets at $90. If not and we see a collapse below $50, then odds are LTC will close lower by the end of the year. This will be undesirable as it could potentially deter coin investment starving the coin of liquidity and capital gains.
XLM/USD: Stellar Price Analysis
Edge, a cryptocurrency security solution provider that offers a platform where users can access and manage multiple digital assets in a secure, easy to use and private interface now supports Stellar Lumens (XLM). While announcing their new 1.4.0 version of their Edge wallet, users can also buy XRP using their credit cards and easily convert from fiat to crypto or crypto to crypto because their integration with Changelly and ShapeShift.
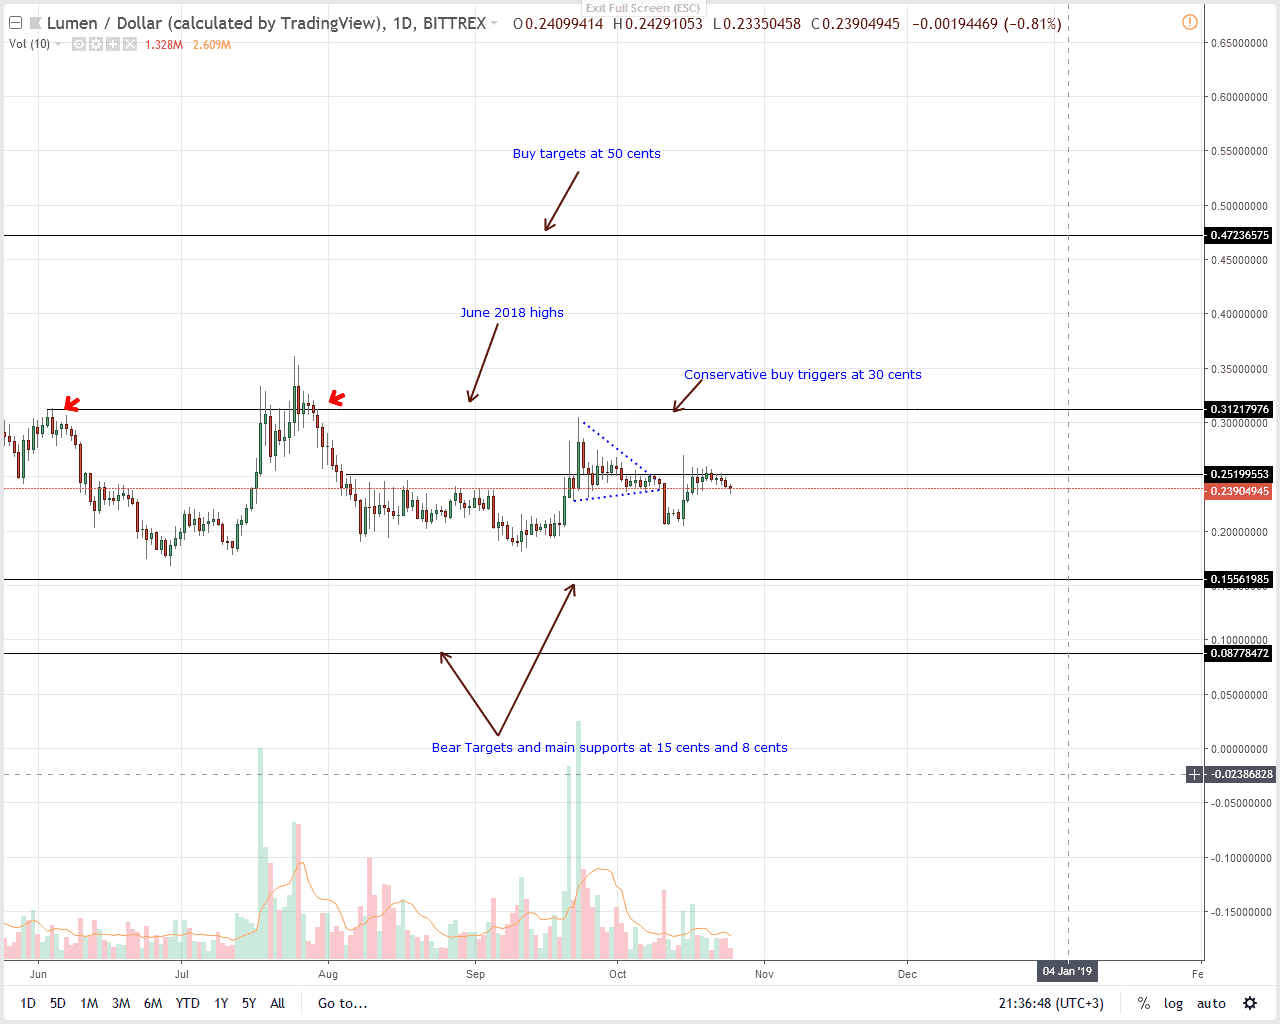
All things constant, our last XLM trade plan is solid and as long as XLM is trading above 18 cents to 20 cents main support line, Stellar Lumens is bullish. Aside from this stand, notice that prices are trending within tight ranges and still held within Oct 15 high low.
From a volume perspective, this is bullish for XLM bulls. Because of this, we recommend bulls to buy on dips in lower time frames with stops just below 20 cents.
However, it would have been preferable if XLM bulls breach the inter-range resistance level at 25 cents. Regardless, if our bullish forecast hold true then traders can add to their longs once prices close above this minor resistance level.
TRX/USD: Tron Price Analysis
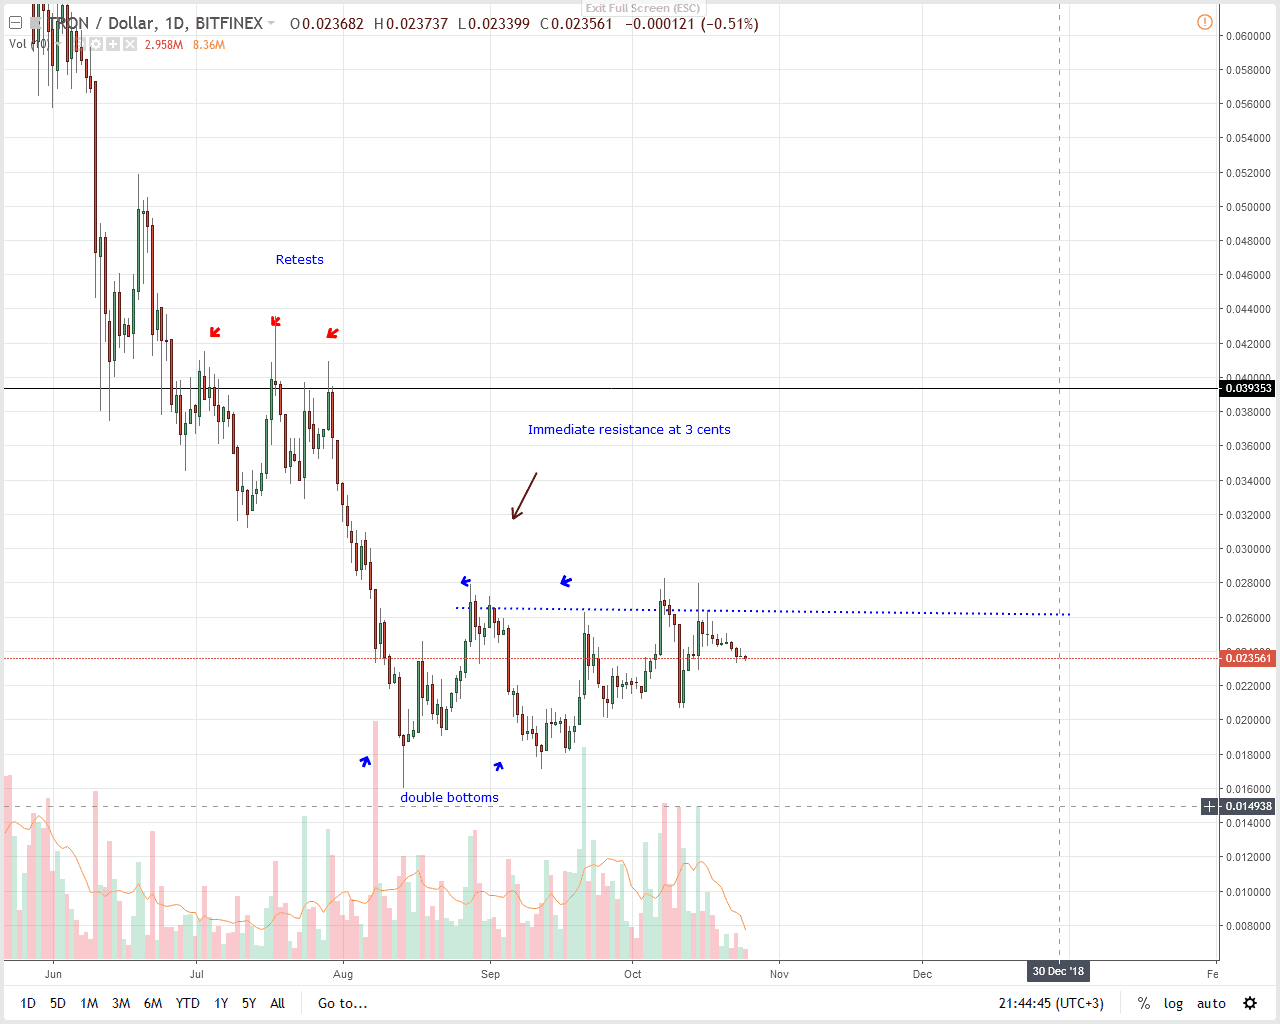
Even after 10 days of lower lows, it appears as if our previous TRX bullish outlook is valid. Notice that despite bears, TRX prices are relatively stable and encouragingly trading inside Oct 15 high low. What’s more, well, TRX bears are yet to completely reverse Oct 15 gains and from a technical point of view that is overly bullish for TRX.
Like before, we suggest aggressive traders to ramp up at spot prices with first targets at 4 cents with stops at 2.2 cents. That’s around Oct 14 lows. But, a more conservative approach would be to wait for gains above Sep 2018 highs at around 2.8 cents to 3 cents before buying on dips with first targets at 4 cents.
IOT/USD: IOTA Price Analysis
Blockport, a new cryptocurrency exchange platform that describes itself as a bridge between traditional finance world and the new digital economy, will soon list IOTA. While it remains tentative, the listing increase the number of IOTA investment avenues.
Hopefully, this will help spur demand lifting the coin back to the top 10 as prices rally. At the moment, traders who hold their native BPT ERC-20 token enjoy 50 percent discount on all their fees and deposits are free of charge.
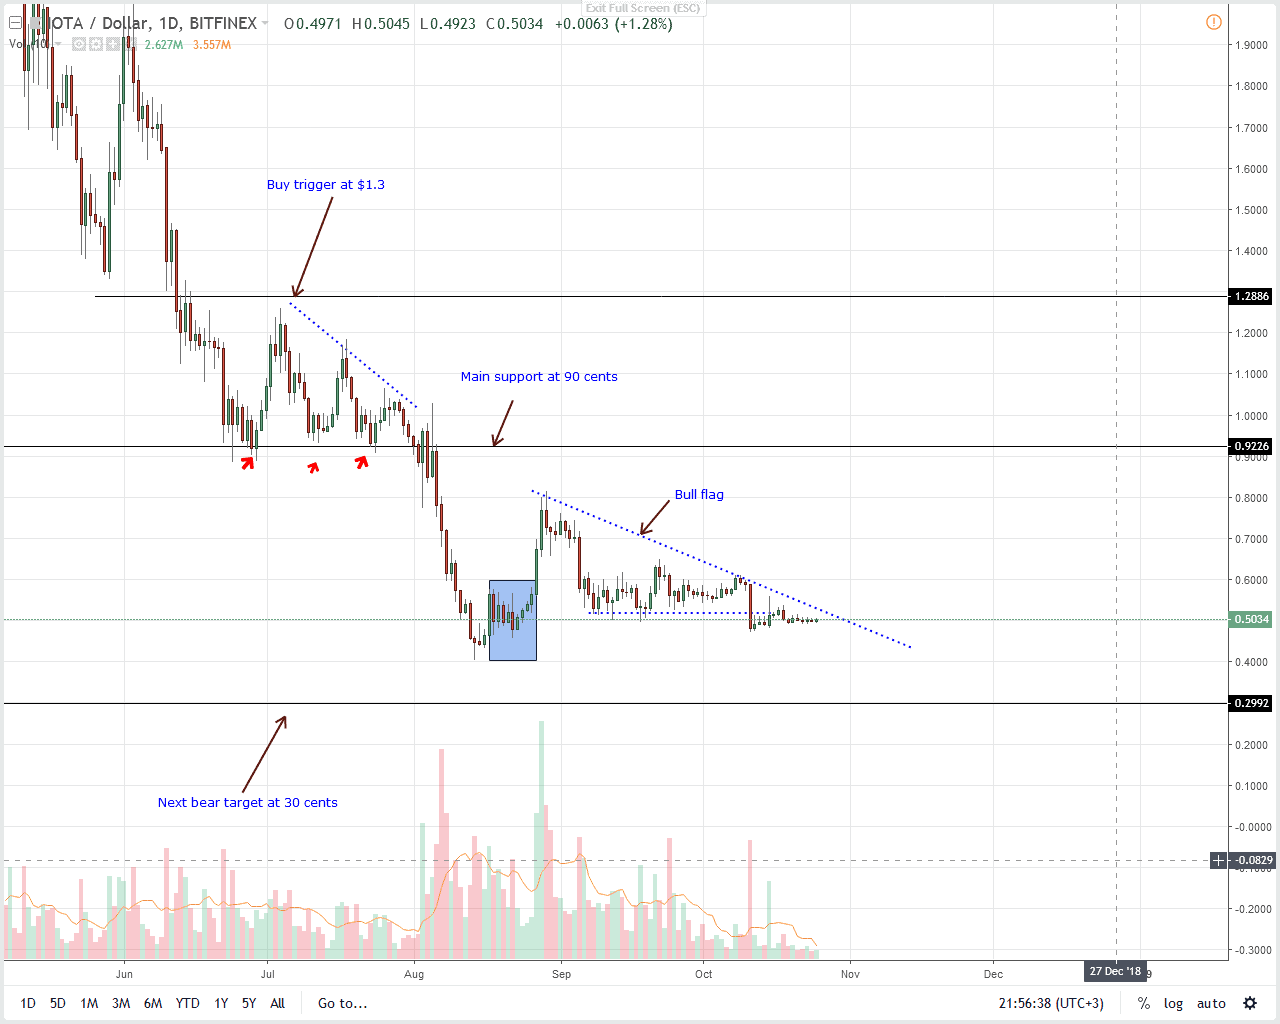
On to the charts and IOTA is pretty stable and ranging just like the rest. As per our previous IOTA price outlook, our trade execution is dependent on break outs above 60 cents or dips below 50 cents.
After sliding 90 percent from 2017 highs, odds are we might see revivals above 60 cents triggering bulls. If that is the case then our first modest bull target will be at 90 cents. However, should we see a meltdown below 50 cents then it’s likely that IOTA shall print 30 cents by end of year.
Disclaimer: Views and opinions expressed are those of the author and aren’t investment advice. Trading of any form involves risk and so do your due diligence before making a trading decision.
The post IOTA Price Analysis: EOS Demand High as IOTUSD Reverse from 50 Cents appeared first on NewsBTC.
Join Our Telegram channel to stay up to date on breaking news coverage
