
Join Our Telegram channel to stay up to date on breaking news coverage
Ether (ETH) token, the foundation of the Ethereum network, recently underwent a dramatic price decline. The slump saw the proof-of-stake (PoS) token fall to its lowest point in three months. Investors and industry watchers are concerned about this unexpected decline. Regulatory pressure and a drop in the use of decentralized applications (DApps) have tempered investor attitude towards Ether.
Furthermore, Ethereum price decline has consequences that go beyond brief fluctuations in market value. It has prompted a thorough investigation of the market variables at work and their possible influence on Ether’s trajectory in the future.
Ether Price Hits Three-Month Low: A Closer Look at Recent Plunge
Between June 13 and June 15, the price of ether fell by 8.27%, reaching its lowest level in three months. Investors’ expectations that the altcoin would reach $2,000 as a support level have been impacted by this downturn.
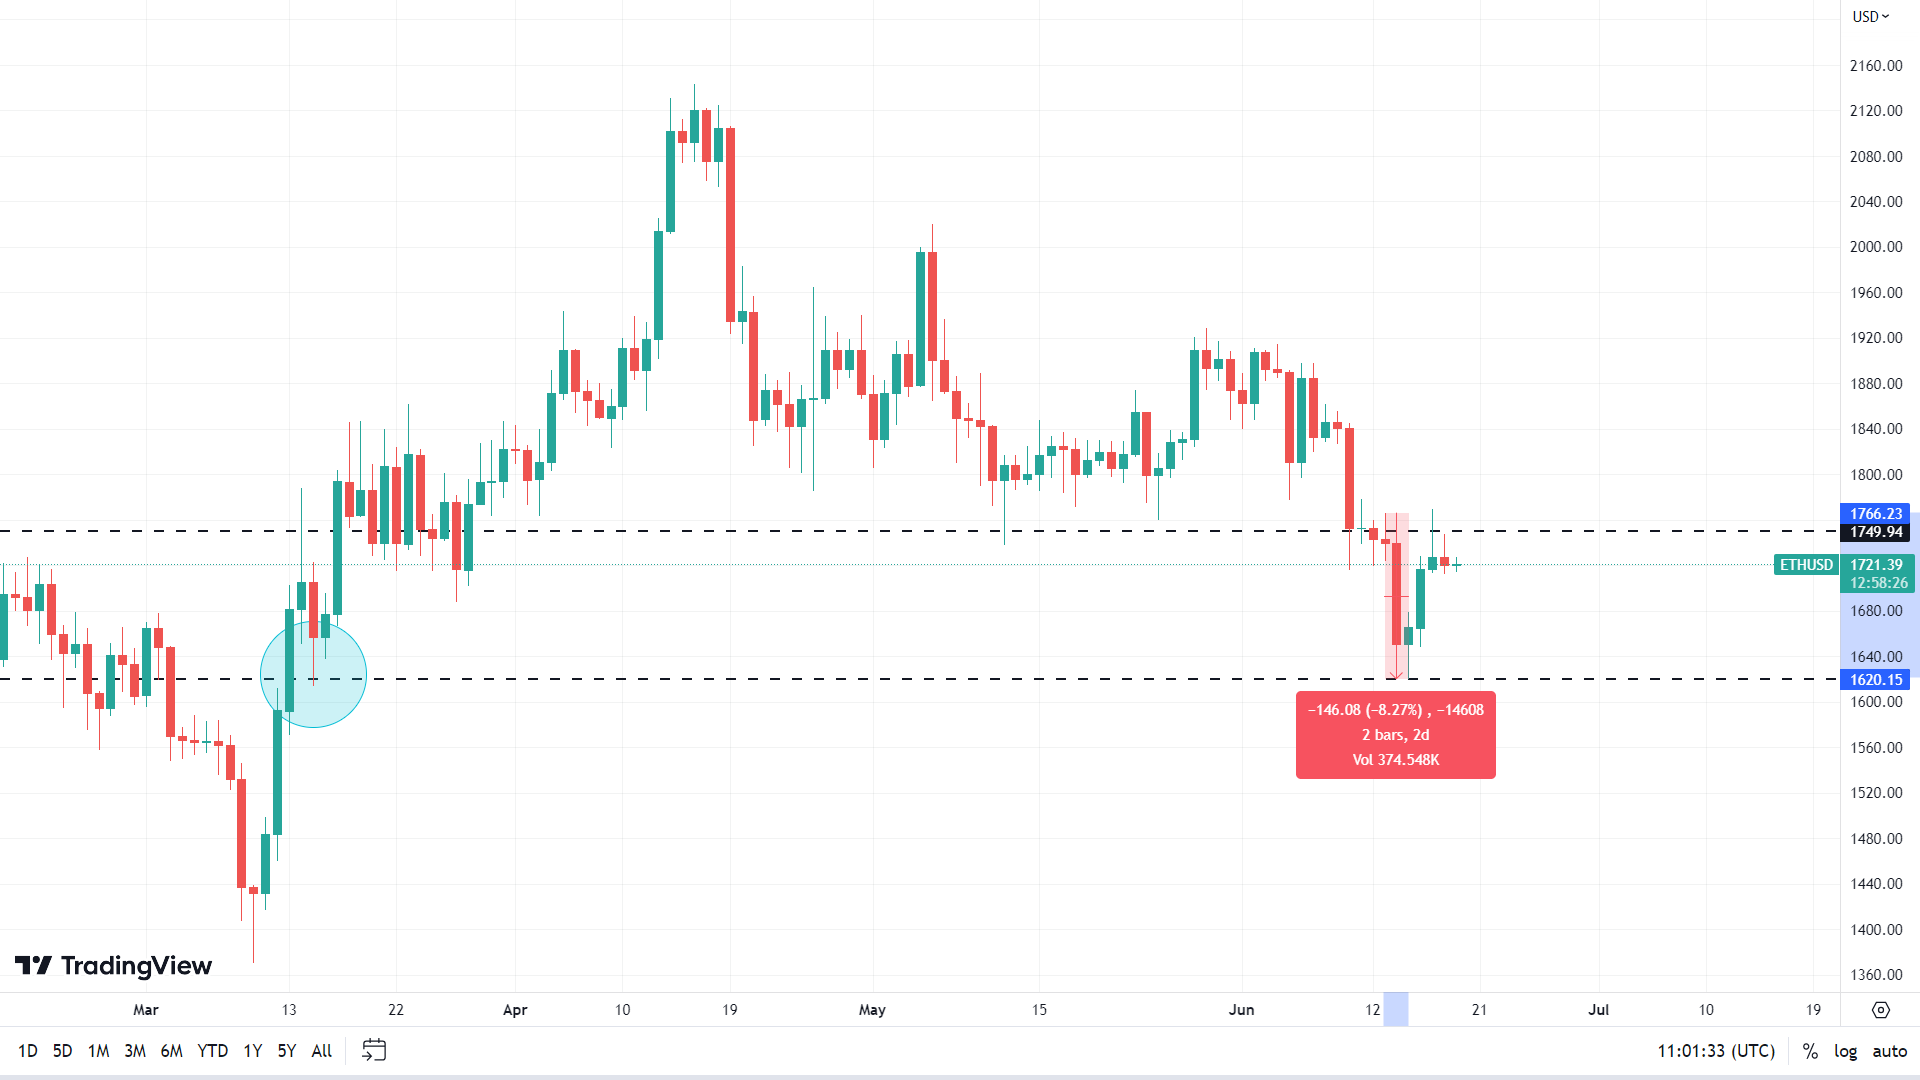
The market capitalization of Ether at the lowest price of $1,620 is $206.94 billion. This is greater than Shell’s market cap of $205.92 billion and slightly lower than McDonald’s $214.42 billion.
Notably, Ethereum is the 61st largest internationally tradable asset. This is rather remarkable considering it is only eight years old and does not produce direct earnings for project maintenance.
Traditional securities, on the other hand, profit from company profits and potential government assistance. Investors may therefore be worried by Ether’s recent price decline.
Regulatory pressures have stifled investor interest in Ether because of the SEC’s proposal to modify the rules governing exchange definitions.
The #SEC has proposed a rule change that would expand the definition of exchanges and would include some #DeFi platforms.https://t.co/yxW2RYN84U#CryptoRegulation #Crypto #Ethereum #Bitcoin
— Crypto Exponentials⚡ (@BitcoinOnwards) June 12, 2023
On the other hand, there has been market opposition to this idea, with claims that it is against the Administrative Procedure Act.
.#Paradigm argues that the #SEC‘s plan to redefine “exchange” and regulate #DEXs as securities exchanges is inappropriate and violates the Administrative Procedure Act.
They call for a quick withdrawal of this proposed rule. pic.twitter.com/Fs2qbZDPfy
— OZARU | Web3 Accelerator (🔥,🔥) (@OzaruLTD) June 10, 2023
3 key Ether price metrics point to growing resistance at $1,750 level
Three main Ethereum price metrics point to growing resistance at the $1,750 level. These have been discussed below.
Passive DApps Activity on Ethereum
Decentralized applications adoption on the Ethereum network has stalled despite a notable reduction in gas fees by 75%. Currently, the average transaction cost has decreased to $3.4 from $9.752 a month ago. However, within the same period, DApp active addresses only increased by 5%.
As of this writing,
• It costs approximately ~$3.50-$4 to swap tokens via $ETH
• It costs less than $0.10 to do the same thing on other rollupsWhen $ETH is in a good place with A LOT of activity, gas fees can surge to $75+ pic.twitter.com/cPOzw61O17
— ItsThatCoolGuy (@ItsThatCoolSoul) June 14, 2023
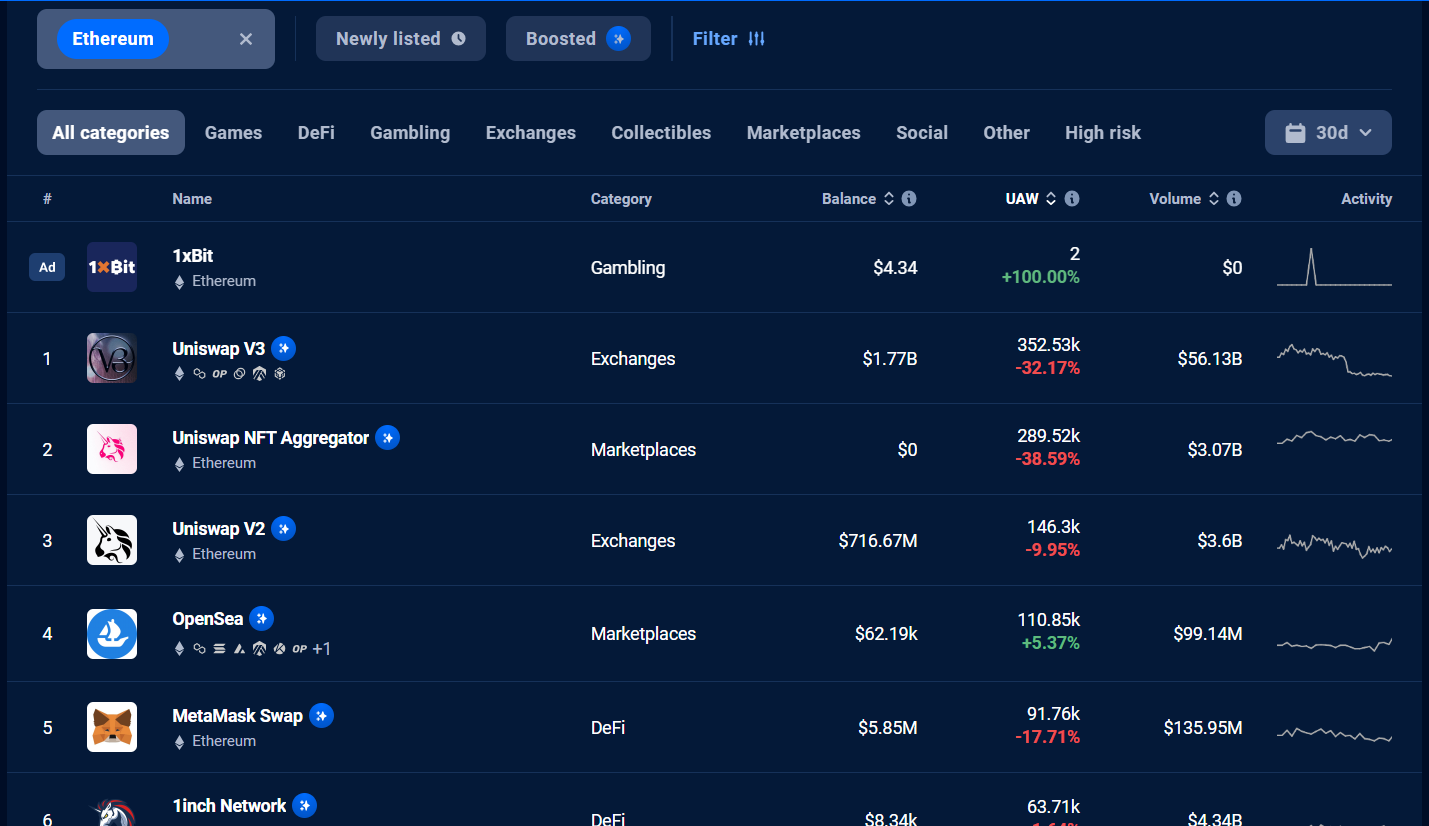
This unresponsive effect of declined transaction cost on ETH Dapp activity affected various sectors. These include decentralized finance (DeFi), gaming, collectibles, and non-fungible token (NFT) marketplaces.
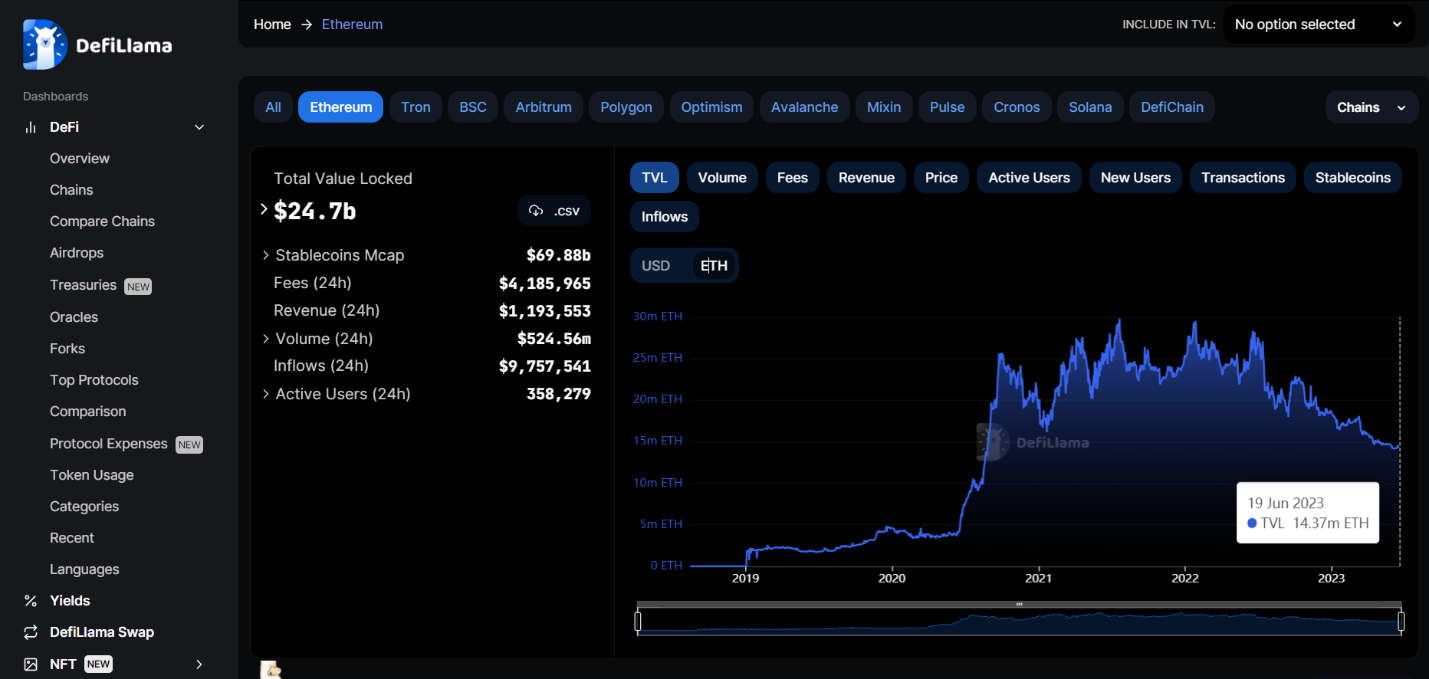
Interestingly, the total value locked (TVL) in Ethereum’s smart contracts also experienced a decrease of 3.94%. Data from DeFiLlama shows that this is relative to mid-May, amounting to 14.37 million ETH.
Reduced ETH Future Premium
ETH quarterly futures are popular among large investors and arbitrage desks. These fixed-month contracts typically trade slightly higher than spot markets, indicating that sellers request more money to delay settlement.
In healthy markets, ETH futures contracts should ideally have a 5% to 10% annualized premium. This is known as contango and is not exclusive to crypto markets.
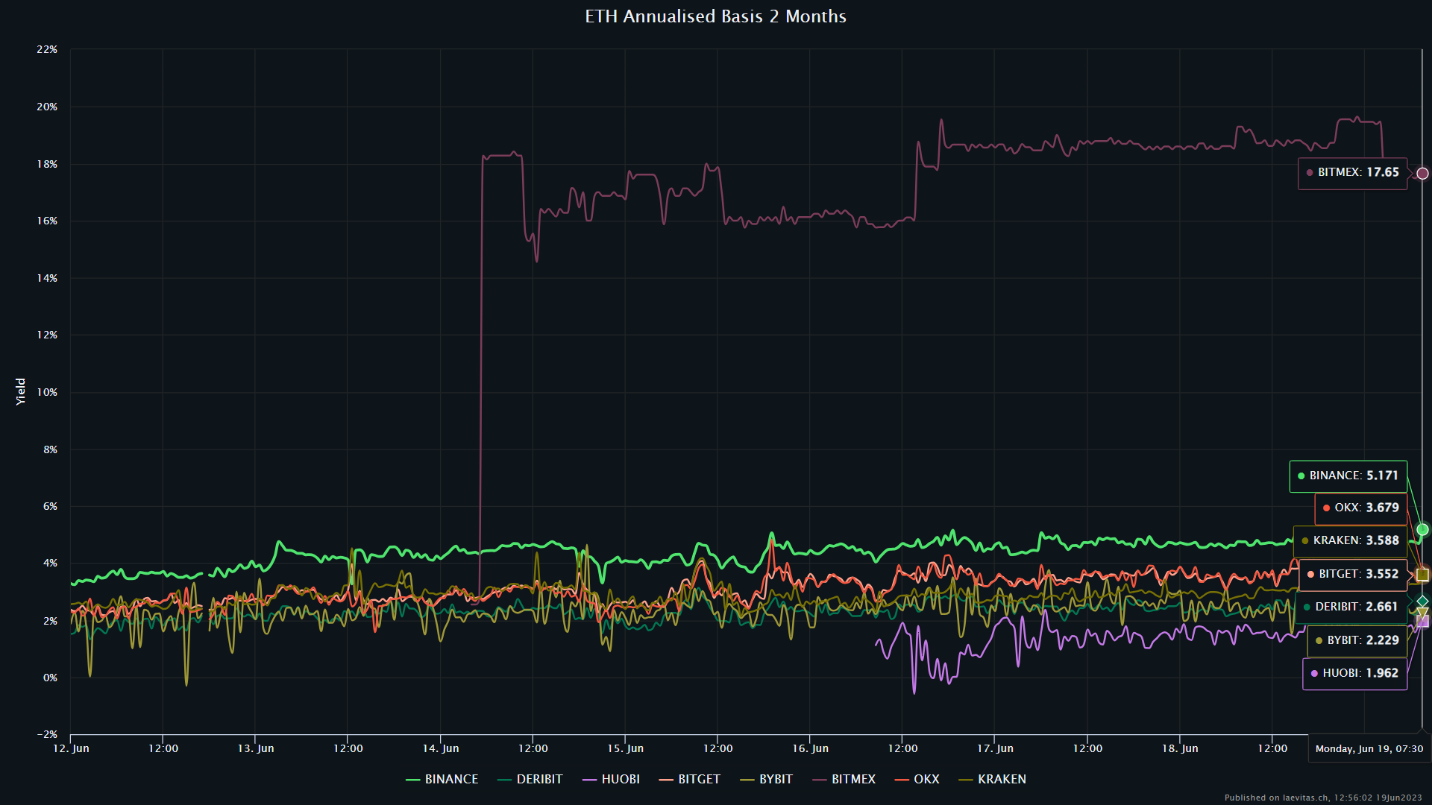
However, based on the futures premium, professional traders have been avoiding bullish bets. Although there has been a modest improvement to 2.2% – 3.5%, the average indicator remains below the neutral 5% threshold on most exchanges. Only Bitmex and Binance surpass the 5% threshold, while other exchanges in the industry struggle to reach that level.
Increased Cost for Protective Put Option
To further analyze external factors that may have solely influenced Ether futures, it is important to look at the ETH options markets.
The 25% delta skew indicator is a useful tool in this regard. It compares the prices of call (buy) and put (sell) options. When fear dominates the market and traders anticipate an Ether price crash, the skew indicator rises above 8%. Conversely, a negative 8% skew indicates general excitement.
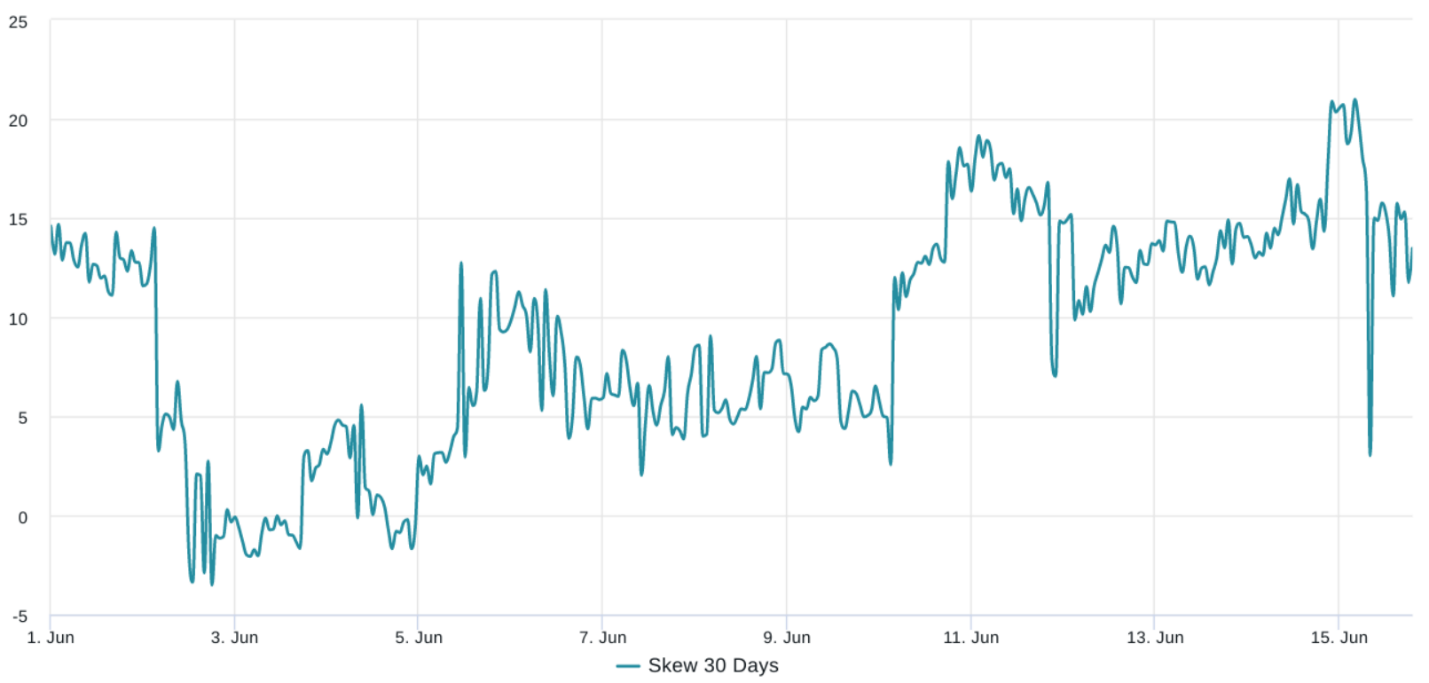
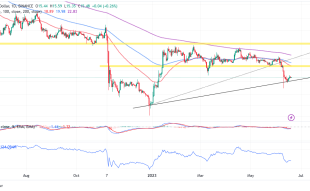
In the given chart above, the delta skew has been signaling fear since June 10. On June 15, it reached its highest level in three months at 21%. This indicates that traders have been concerned about a potential downturn in Ether’s price.
$ETH 25 delta skew getting pretty damn high again.
Last time this happened was March 11-12 🤔 pic.twitter.com/A249RfJBmx
— Byzantine General (@ByzGeneral) June 15, 2023
It is worth noting that investors often focus on short-term price movements and may overlook important factors. Despite any current concerns, Ether’s price has actually increased by 52.9% year-to-date in 2023. However, relying heavily on Ethereum’s Total Value Locked (TVL) of $24.7 billion may cause traders to overlook signs of weakening demand for decentralized application usage.
Decrypting Ether’s Recent Price Drop: What Lies Ahead for the Altcoin?
The current market conditions favor the bears, as indicated by the ETH derivatives metrics. This suggests that there is a higher likelihood of Ether’s price retesting the $1,560 support level. However, it is important to note that this does not necessarily mean that the gains achieved in 2023 are at risk.
The main obstacle for the bulls is the presence of regulatory FUD, which creates fear, uncertainty, and doubt among investors. As long as these regulatory concerns persist, it will be challenging for bulls to drive Ether price above the significant resistance level of $1,750.
Related News
- Ethereum Revolutionizes the NFT Stage With Ethscriptions
- Ethereum’s Road to Glory: Trader Foresees 45% Rally and Impending Breakout
- Ethereum’s Staked ETH Set to Exceed Exchange Holdings, Reflecting Growing Confidence in Decentralization
Best Wallet - Diversify Your Crypto Portfolio

- Easy to Use, Feature-Driven Crypto Wallet
- Get Early Access to Upcoming Token ICOs
- Multi-Chain, Multi-Wallet, Non-Custodial
- Now On App Store, Google Play
- Stake To Earn Native Token $BEST
- 250,000+ Monthly Active Users
Join Our Telegram channel to stay up to date on breaking news coverage