Join Our Telegram channel to stay up to date on breaking news coverage
GBPJPY Price Analysis – June 11
The market opened today with a bullish candle on the daily chart, the price is moving towards $139 level. Increase in the Bulls’ pressure may lead to a further increase in the GBPJPY price that may reach $139 level.
GBP/JPY Market
Key levels:
Supply levels: $139, $141, $143
Demand levels: $136, $134, $130
GBPJPY Long-term trend: Bearish
GBPJPY is bearish on the long-term outlook. GBPJPY found support at the demand level of $136 under the bearish momentum. The Bears were unable to penetrate the mentioned demand level. An inside bar candle pattern formed at $136 level; this is a bullish reversal candle pattern. The bulls slowly pushed up the GBPJPY price towards $139 price level. The daily candle formed yesterday was bearish which served as a pullback to the market. The market opened today with a bullish candle on the daily chart, the price is moving towards $139 level.
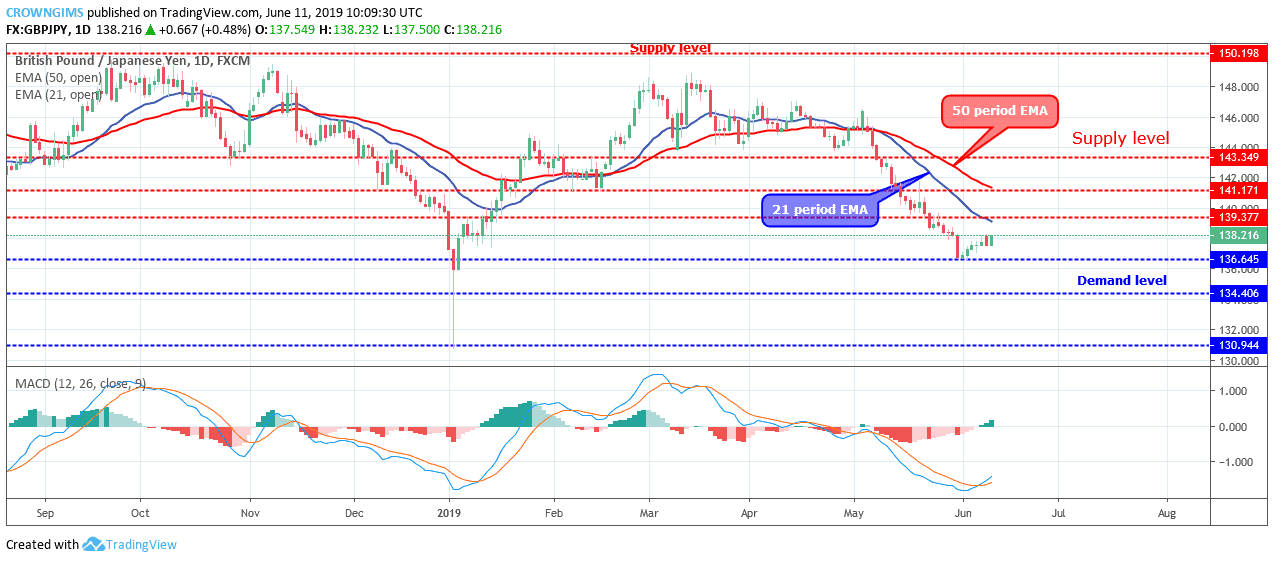
Increase in the Bulls’ pressure may lead to a further increase in the GBPJPY price that may reach $139 level. However, GBPJPY continues its trading below 21 periods EMA and 50 periods EMA, with a decrease in the distance between the price and the EMAs which is a sign of the Bulls’ increase momentum. The histogram of the Moving Average Convergence Divergence period 12 is above zero levels and its signal lines pointing up to indicates buy signal.
GBPJPY medium-term Trend: Bullish
On the medium-term outlook, GBPJPY is bullish. The bulls are gradually taking over the GBPJPY market. The currency pair has penetrated the dynamic support and resistance level and the price is currently above the 21 periods EMA and 50 periods EMA; this is a sign of a bullish movement.
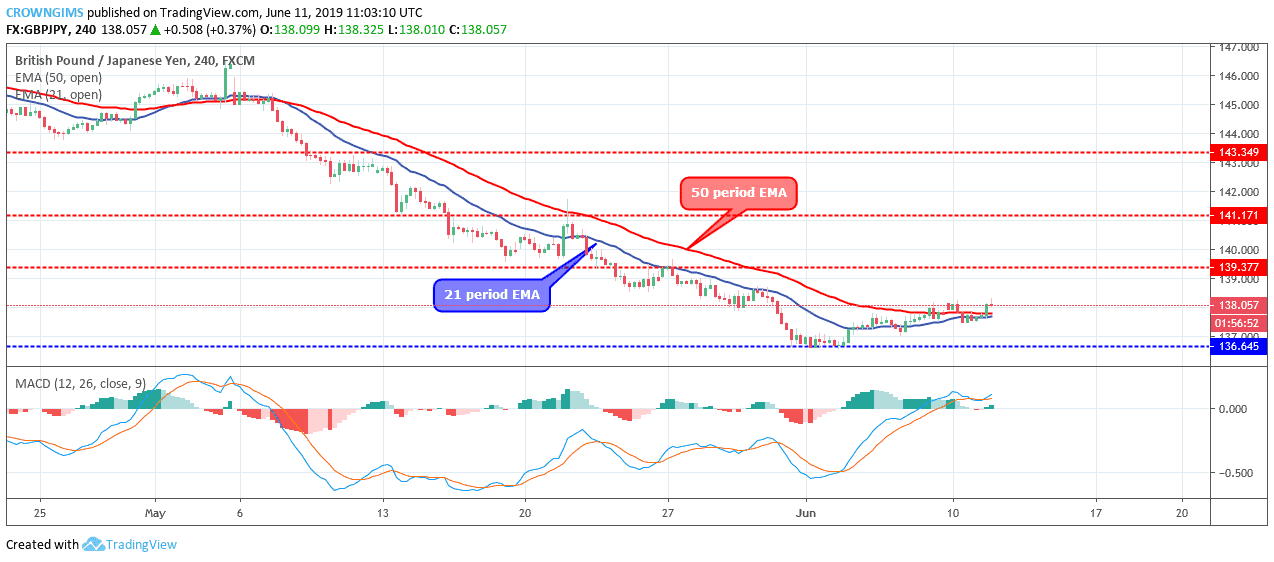
Meanwhile, the MACD period 12 with the histogram is above zero levels and the signal lines bending upward to indicate a buy signal.
Please note: insidebitcoins.com is not a financial advisor. Do your own research before investing your funds in any financial asset or presented product or event. We are not responsible for your investing results.
Join Our Telegram channel to stay up to date on breaking news coverage