Join Our Telegram channel to stay up to date on breaking news coverage
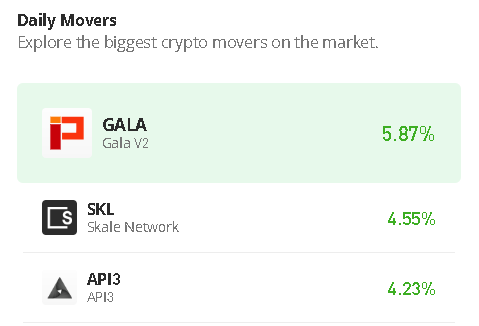
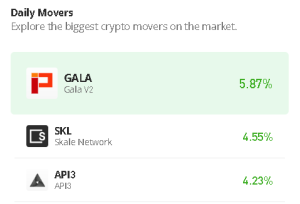
The Gala price prediction shows that GALA is moving higher and could break above the resistance of $0.030 if the bulls increase the pressure.
Gala Prediction Statistics Data:
- Gala price now – $0.023
- Gala market cap – $514 million
- Gala circulating supply – 21.6 billion
- Gala total supply – 24 billion
- Gala Coinmarketcap ranking – #68
GALA/USD Market
Key Levels:
Resistance levels: $0.035, $0.037, $0.039
Support levels: $0.013, $0.011, $0.009
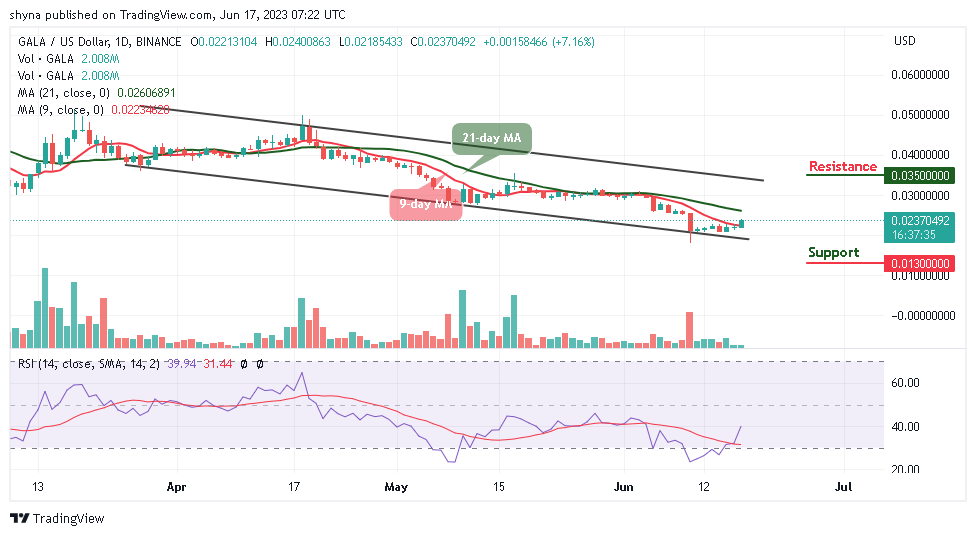
GALA/USD keeps the bullish movement as the coin crosses above the 9-day moving average; the Gala (GALA) is making a gain of 7.16% and touches the daily high of $0.024. Meanwhile, traders can expect the Gala to prepare itself steadily for a ride toward $0.025.
Gala Price Prediction: GALA Price Ready for the Upside
In the last few days, the Gala price has moved from $0.015 to $0.024 and at the same time moving toward the upper boundary of the channel. However, the ongoing trend may move a little bit higher in the coming week if the 9-day moving average crosses above the 21-day moving average and could reach the nearest resistance at $0.030, therefore, any further bullish movement could hit additional resistance levels at $0.035, $0.037, and $0.039 respectively.
Nevertheless, a bearish drop below the lower boundary of the channel may roll the market back to the downside, and the initial support level of $0.015. However, the support levels could be located at $0.013, $0.011, and $0.009. Moreover, as the trading volume increases, the technical indicator Relative Strength Index (14) moves to cross above the 40-level which indicates that more bullish signals may come to play.
When compares with Bitcoin, Gala is currently trading above the 9-day moving average. The price is changing hands at 89 SAT as the technical indicator Relative Strength Index (14) moves to cross above the 40-level. However, the daily chart reveals that the coin is retreating after touching the daily high of 90 SAT.
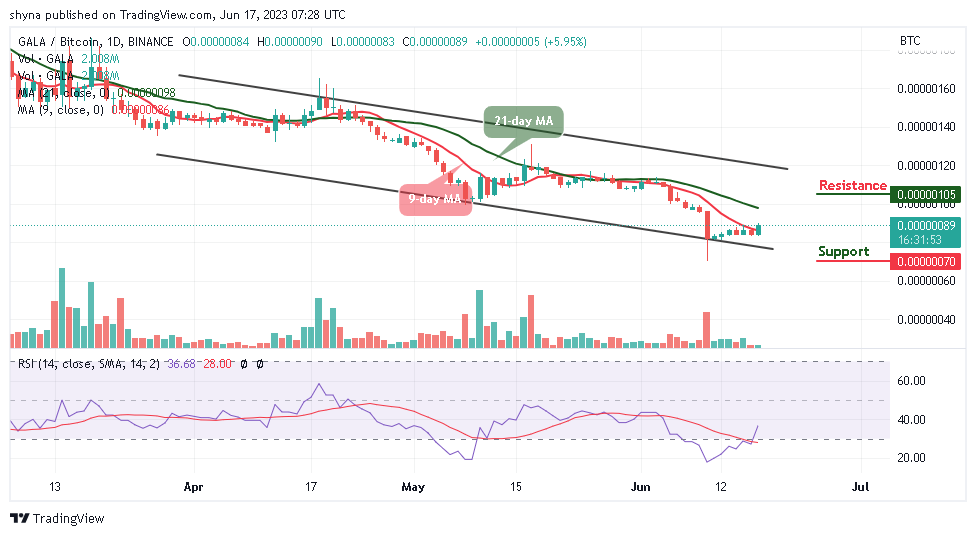
Negatively, the critical support level could be located at 70 SAT and below. Inversely, a higher sustainable move toward the upper boundary of the channel could attract new buyers to the market with the next resistance at 105 SAT and above.
Gala Alternatives
The Gala price can only maintain the uptrend if the newly touched $0.021 support level is maintained at all costs. At the moment, the technical indicator Relative Strength index (14) is seen moving to cross above the 40-level by creating more bullish signals, this could encourage more buyers to enter the market. On that note, a new cryptocurrency, Wall Street Memes (WSM), is bucking the trend and standing firm against the bearish tide. Although the broader crypto market has taken a hit, Wall Street Memes (WSM) has remained resilient and this has become a hot topic among influential YouTubers in the crypto space. However, the token has raised almost $8m in the ongoing presale.
New OKX Listing - Wall Street Memes

- Established Community of Stocks & Crypto Traders
- Featured on Cointelegraph, CoinMarketCap, Yahoo Finance
- Rated Best Crypto to Buy Now In Meme Coin Sector
- Team Behind OpenSea NFT Collection - Wall St Bulls
- Tweets Replied to by Elon Musk
Join Our Telegram channel to stay up to date on breaking news coverage
