
Join Our Telegram channel to stay up to date on breaking news coverage
AUDJPY Price Analysis – May 24
Should the Bulls defend the $75 level, the price may rally towards $77 – $79 level. In case the Bears maintain or increase their pressure; $75 level may be penetrated and the price may decline to $73 demand level.
AUD/JPY Market
Key levels:
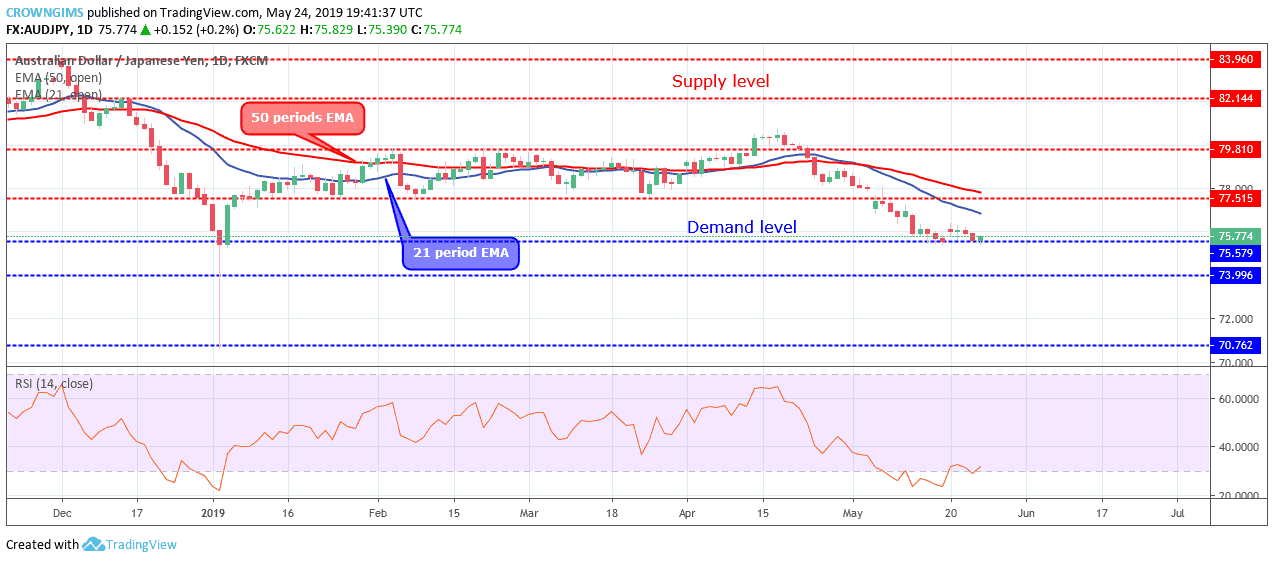
Supply levels: $77, $79, $82
Demand levels: $75, $73, $70
AUDJPY Long-term trend: Bearish
AUDJPY maintains its bearish trend on the long-term outlook. Bearish trend continues in the AUDJPY market on the daily chart. The market closed last week with a bearish candle on the demand level of $76. There was a gap between the daily candle formed on May 17 and the daily candle formed on May 20; the price jumped upside and the bearish trend continues slowly to touch the low of $75 level today.
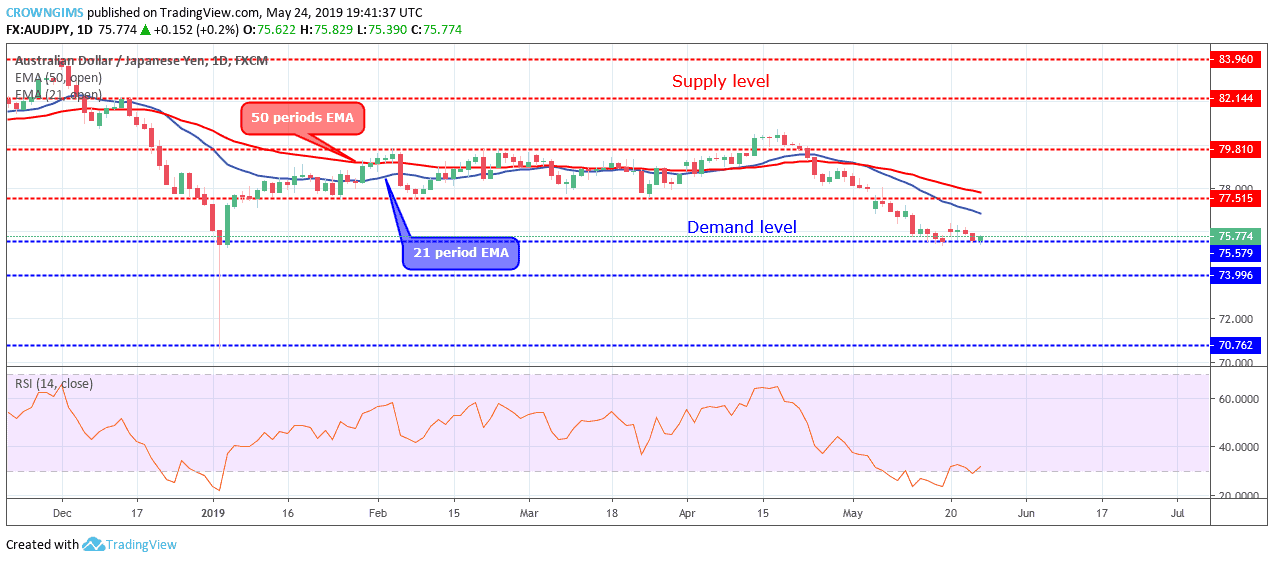
The 21 periods EMA has crossed below 50 periods EMA and the AUDJPY pair is trading below the two EMAs which indicate a bearish trend in the AUDUSD market. The Relative Strength Index period 14 is above 30 levels and the signal lines bending upside to indicate a buy signal. Should the Bulls defend the $75 level, the price may rally towards $77 – $79 level. In case the Bears maintain or increase their pressure; $75 level may be penetrated and the price may decline to $73 demand level.
AUDJPY medium-term Trend: Bearish
On the medium-term outlook, AUDJPY remains bearish. The Bears’ momentum is getting weaker as the price is slowly decreasing in the 4-hour chart. This scenario leads to price consolidation. The Bearish pressure has dropped the price at the demand level of $75 today.

The currency pair is trading and hovering on and around the 21 periods EMA and 50 periods EMA with the two EMAs moving closer to each other as a sign of weak momentum. The Relative Index period 14 is above 40 levels and the signal lines bending up to indicate a buy signal.
Please note: insidebitcoins.com is not a financial advisor. Do your own research before investing your funds in any financial asset or presented product or event. We are not responsible for your investing results.
Join Our Telegram channel to stay up to date on breaking news coverage