Join Our Telegram channel to stay up to date on breaking news coverage
Bitcoin (BTC) Price Analysis – May 24
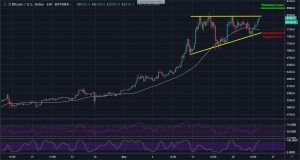
For the past 10 days, Bitcoin has traded below the $8400 as the buyers struggled to surpass this level. Ever since, the price level has become a strong resistance for the market. If the $8400 level breaks, Bitcoin might set a new price at around $8800. However, the sellers’ target is at$7600.
BTC/USD Long-term Trend: Bullish (1D chart)
Key Levels:
Resistance levels: $8500, $8800
Support levels: $7600, $7200
The bullish scenario is still intact as Bitcoin continued to climb upward. The bulls are back above the $8000 after a three days pull to $7600, which has now been a support level for the market. The $8400 is getting tougher for the bulls.
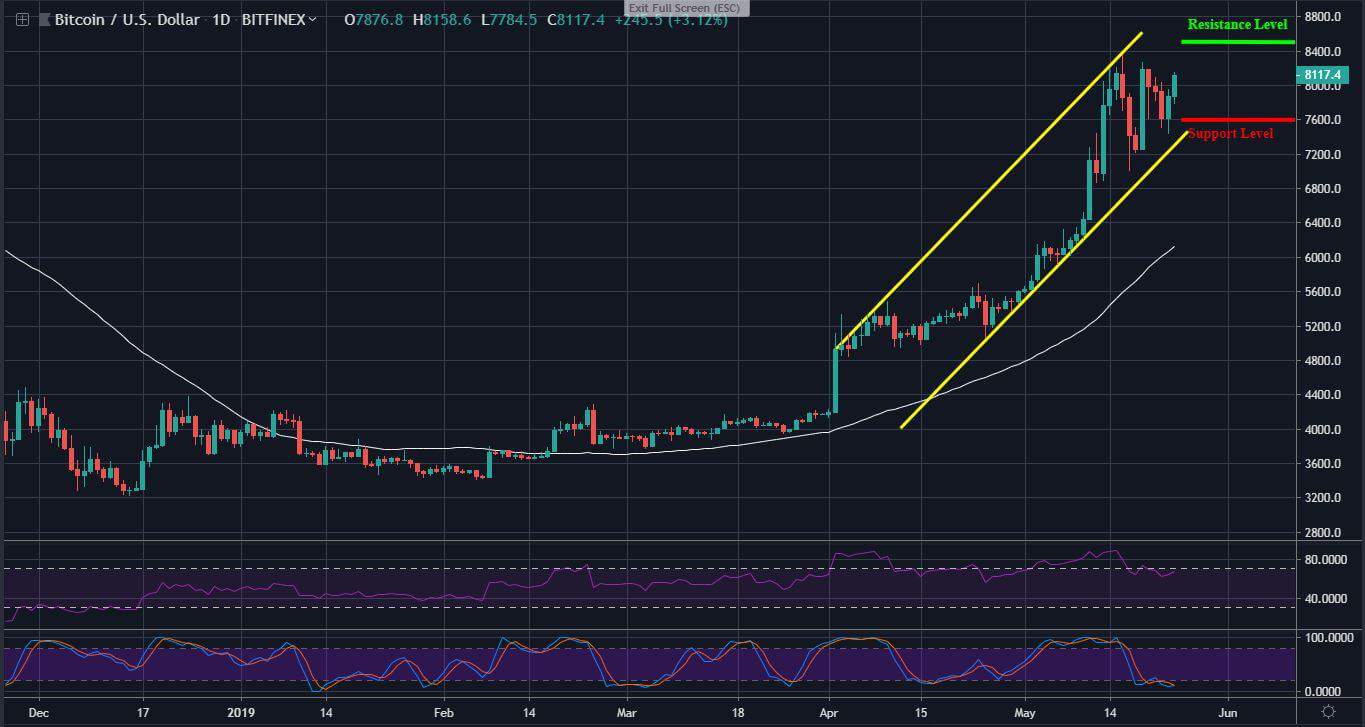
If they manage to surpass the above level, BTC trading might touch the $8500 before visiting the $8800. Meanwhile, the white 50-day moving average has been playing along with the positive move. A bounce down, however, could floor the price at $7600. Below this level lies the $7200 support.
Considering the technical indicators, the daily RSI has pulled back from the overbought region due to a three days sell-off. On the daily Stochastic RSI, Bitcoin lies in the oversold territory.
BTC/USD Medium -term Trend: Bullish (4H Chart)
Bitcoin trading has constructed an ascending triangle formation on the medium-term outlook as price close-up the angle of the trend line. BTC is currently testing the triangle resistance which could lead to a break or rejection. This formation is mostly and commonly followed by a bullish break.
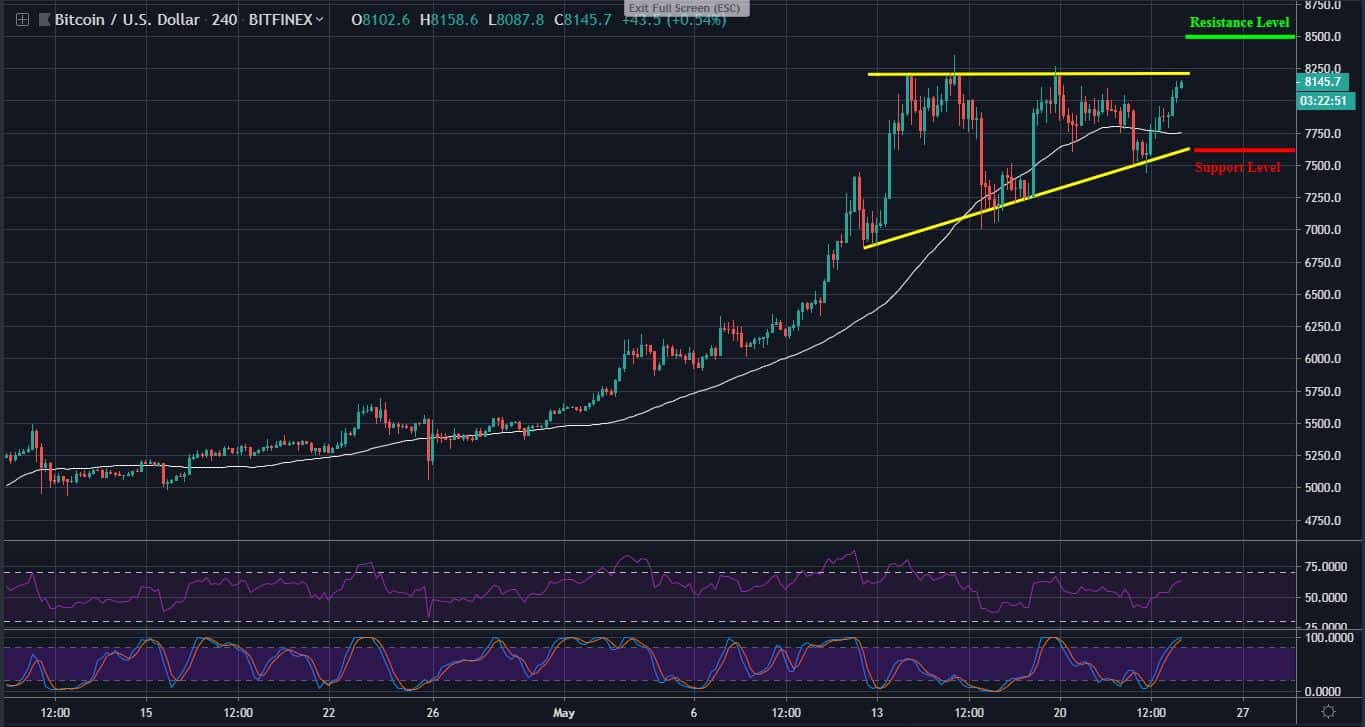
The $8500 is more likely to provide resistance for a potential break. Meanwhile, the $8250 level has been strongly in the hold of buying pressure. A bounce low may locate support at the $7600. Beneath the triangle lies further support at $7250, this could welcome the bears into the market.
While Stochastic RSI is reflected at the overbought territory, the RSI has raised above the 50 level; revealing the 24-hour surge. Still, the important 50-day MA (white) continued to support the market.
Please note: insidebitcoins.com is not a financial advisor. Do your own research before investing your funds in any financial asset or presented product or event. We are not responsible for your investing results.
Join Our Telegram channel to stay up to date on breaking news coverage