Join Our Telegram channel to stay up to date on breaking news coverage
The Fetch.ai price prediction shows that FET could spike a significant surge as the price breaks above the resistance level of $0.090.
Fetch.ai Prediction Statistics Data:
- Fetch.ai price now – $0.093
- Fetch.ai market cap – $157 million
- Fetch.ai circulating supply – 821.1 million
- Fetch.ai total supply – 1.1 billion
- Fetch.ai Coinmarketcap ranking – #145
FET/USD Market
Key Levels:
Resistance levels: $0.300, $0.320, $0.340
Support levels: $0.085, $0.065, $0.045
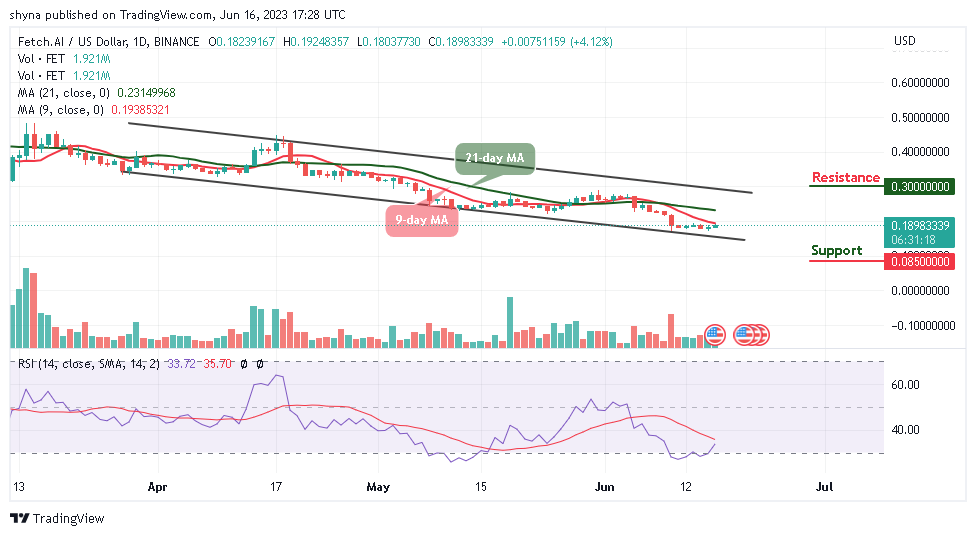
FET/USD is seen refreshing to a new high after touching the daily low of $0.192 to breach above $0.200 while currently trading at $0.189 with a bullish movement toward the 9-day and 21-day moving averages. While bears are attempting to bring the price down, meanwhile, the bulls may try to collect more on any price dips.
Fetch.ai Price Prediction: Fetch.ai (FET) Could Trigger Fresh Rally
Looking at the daily chart, the Fetch.ai price can only increase the bullish movement if the $0.180 support is maintained at all costs. Currently, the technical indicator Relative Strength Index (14) is likely to cross above 40-level by sending bullish signals into the market which can encourage more buyers to enter the market.
Meanwhile, Fetch.ai (FET) may continue to do well and the market price may reach the resistance levels at $0.300, $0.320, and $0.340 respectively. On the contrary, if the market price decides to make a quick cross below the lower boundary of the channel, then, there could be a quick bearish drop which may bring the market down to the support levels of $0.085, $0.065, and $0.045 respectively.
When compares with Bitcoin, the Fetch.ai price is moving to cross above the 9-day and 21-day moving averages as the price faces the upper boundary of the channel. Meanwhile, the technical indicator Relative Strength Index (14) is seen recovering from the oversold region. However, for the fact that the coin may cross above the 9-day moving average, it is likely to hit the nearest resistance level of 800 SAT.
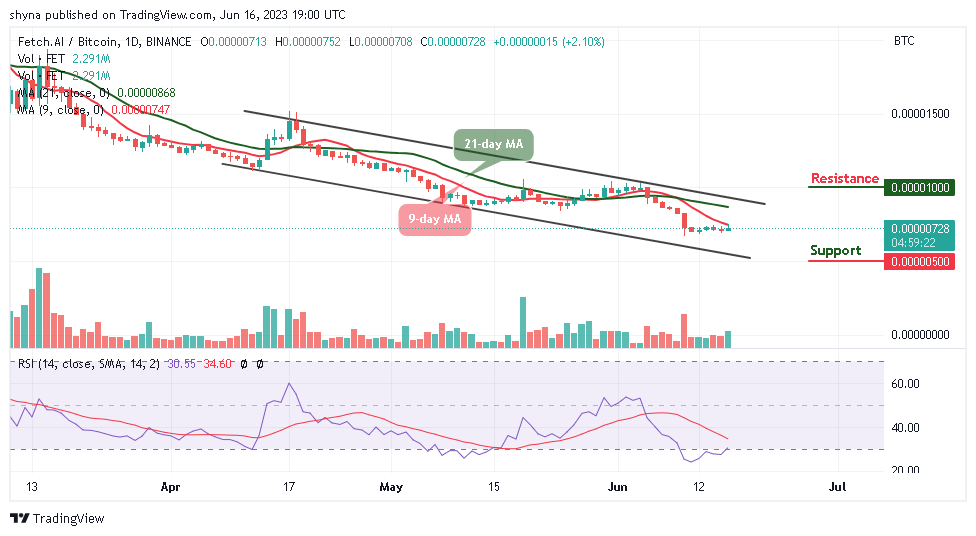
Moreover, the daily chart reveals that the potential resistance level is located at 900 SAT and above, but a bearish move may likely cancel the bullish pattern, which could attract new sellers coming into the market with the next focus on the support level of 500 SAT and below.
Alternatives to Fetch.ai
The Fetch.ai is seen refreshing to a new high after touching the daily low of $0.180 to breach above $0.190 while currently trading at $0.189 with a bullish cross toward the 9-day and 21-day moving averages. While bears are attempting to bring the price down, meanwhile, the bulls may try to collect more on any price dips. Nevertheless, as a result, many big investors of Wall Street Memes found themselves in an unprecedented short squeeze. They were on the verge of bankruptcy until several online brokerage firms, such as Robinhood, stopped GameStop trades. Therefore, its presale has now raised almost $7 million as this could be the best time to invest.
New OKX Listing - Wall Street Memes

- Established Community of Stocks & Crypto Traders
- Featured on Cointelegraph, CoinMarketCap, Yahoo Finance
- Rated Best Crypto to Buy Now In Meme Coin Sector
- Team Behind OpenSea NFT Collection - Wall St Bulls
- Tweets Replied to by Elon Musk
Join Our Telegram channel to stay up to date on breaking news coverage