Join Our Telegram channel to stay up to date on breaking news coverage
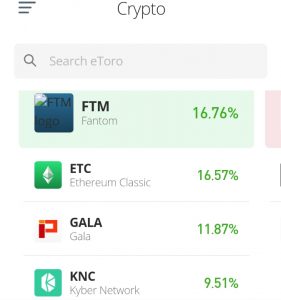
FTM/USD rose to the top of the crypto daily mover list today. Although It was a tough battle between Fantom and Ethereum Classic, nevertheless Fantom came on top. This crypto has moved nearly 17% upward today. Will this crypto experience more upside movement or not? This will be answered in a bit.
FTM price now 0.3210
FTM Market Cap: 841.9 million
FTM Total Supply: 2.6 billion
FTM Rank: 55
Key Levels:
Resistance: $0.280, $0.300, $0.321
Support: $0.310, $0.270, $0.250
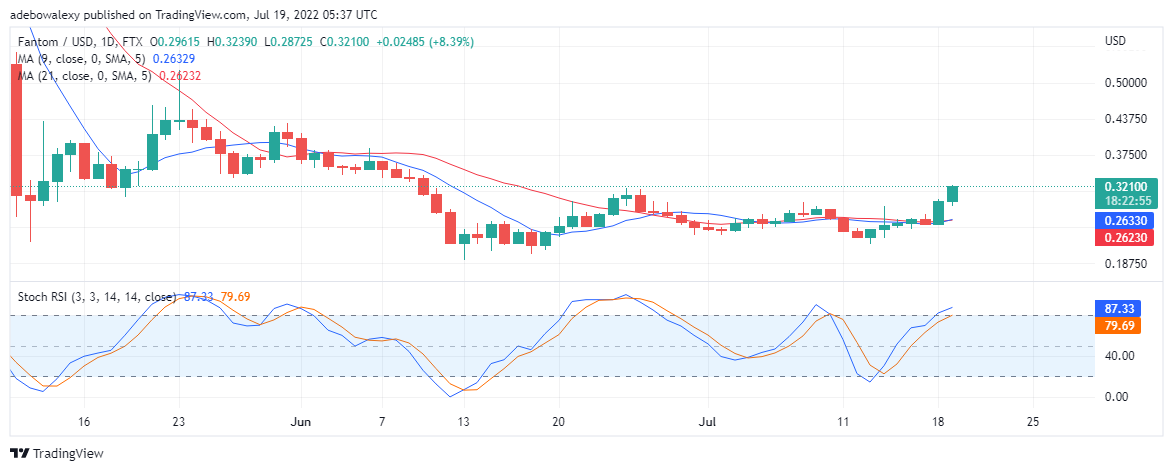
FTM/USD Value Forecast: Weakness in Fantom’s current Upside Trend
Although FTM/USD has experienced some nice gains today, there are hints of weakness on this crypto price chart. We can see from the daily chart that the last two candlesticks are bullish in appearance and were able to form above the MA curves. Consequently, this reflects the movement in the crypto price as seen on the daily mover list.
Also, SRSI (Stochastic Relative Strength Index) indicator, displays its lines rising steadily into the overbought region. Furthermore, critical examination reveals that the quicker SRSI curve appears to be making a downward curve. Given the distance of separation between the two lines, we might say that a trend reversal will soon occur. At most, we can anticipate that the value of this crypto to only reach $0.3750 and $0.400 before the price ranges or reverses.
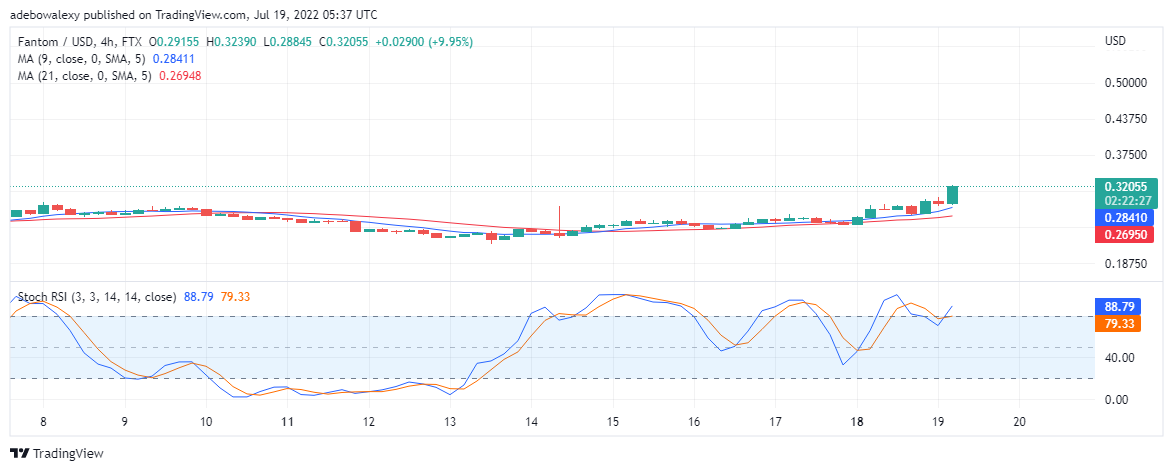
FTM/USD Value Forecast Fantom Uptrend Progress as Predicted
On the FTM/USD four-hour chart, we can notice that the price stays roughly the same. Furthermore, we can see that the quicker MA curve now rises upwards, although still under the price motion. This implies that the chances of a more radical upward price movement are reducing.
Also, looking at the SRSI indicator, we can see that these indicator lines are already in the oversold area. And, with more careful consideration, we can see that we are only left with less than 20% steps to reach 100%mark. Consequently, this indicates that not much upward price change will occur in this market.
Join Our Telegram channel to stay up to date on breaking news coverage