Join Our Telegram channel to stay up to date on breaking news coverage
Bears may exert more pressure in Fantom Market
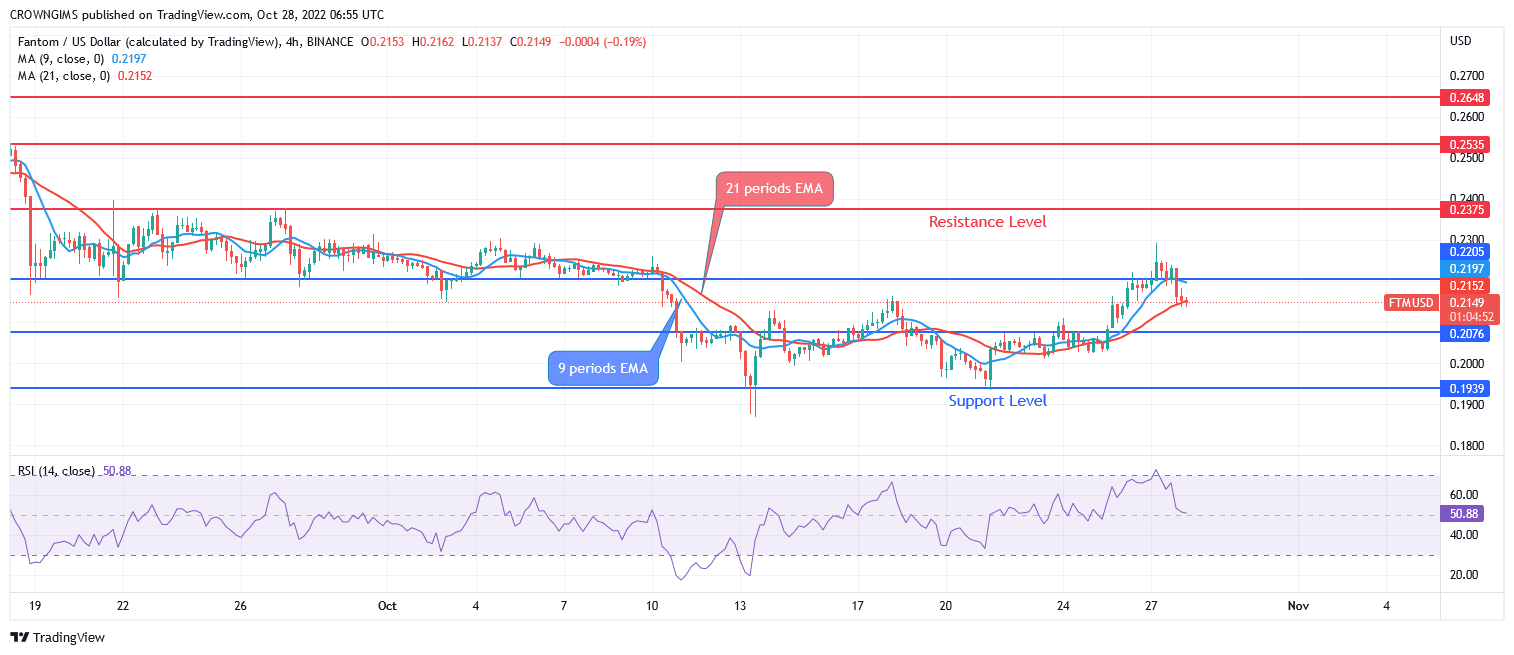
An increase in the buyers’ pressure may break up $0.22 level and expose the price to $0.23 and $0.25 resistance levels. Fantom may decrease to $0.19 and $0.18 levels provided the support level of $0.20 does not hold.
Fantom Price Analysis – October 28
FTMUSD Market
Key levels:
Resistance levels: $0.22, $0.23, $0.25
Support levels: $0.20, $0.19, $0.18
FTMUSD Long-term Trend: Bullish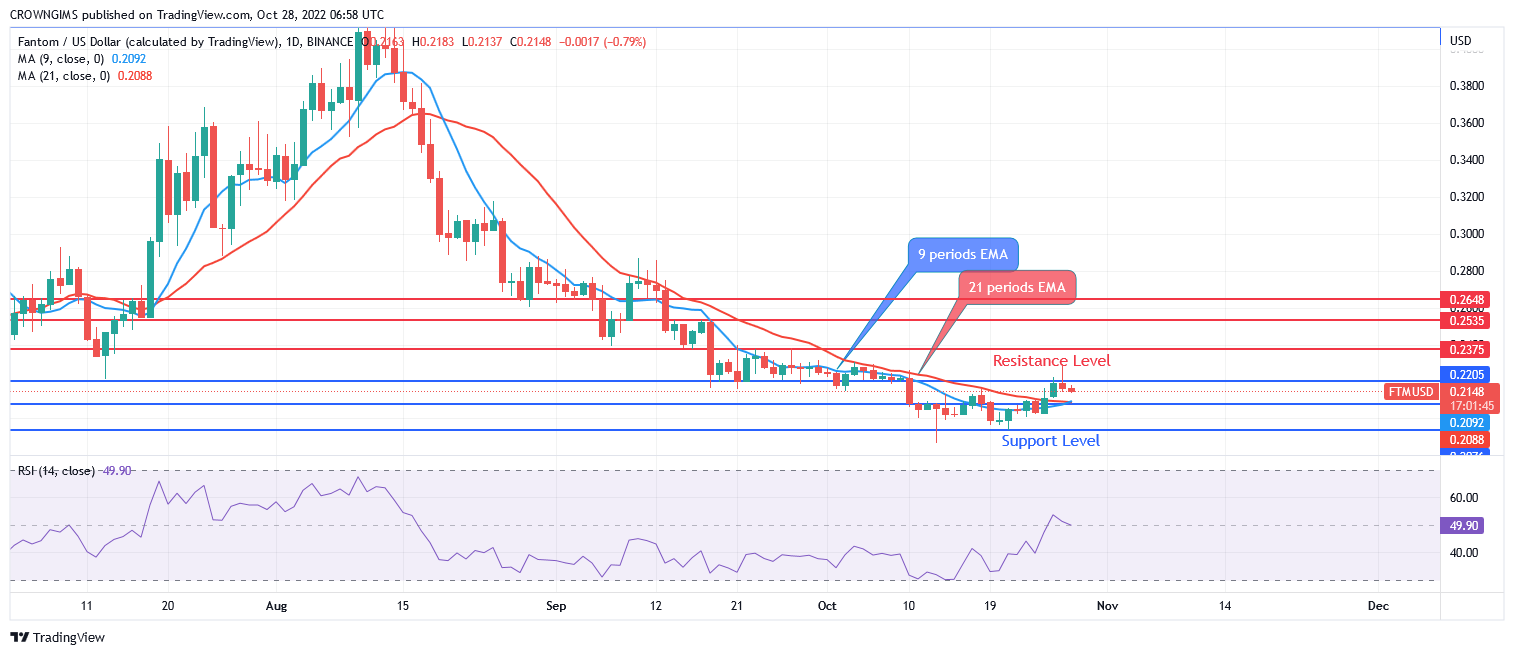
Fantom is on the bullish movement in daily chart. Bulls are trying to pause the bearish journey that started on 13 August. In other words, buyers’ momentum is increasing more than the sellers’ momentum. The price eventually found support at $0.18, the price consolidate for many days within the $0.20 and $0.19. The bulls gained momentum and break up $0.20 and $0.22 levels. It is currently pulling back.
Fantom price is trading above the 9 periods EMA and 21 periods EMA at close distance indicating an increase in the bulls’ momentum. The relative strength index period 14 is at 47 levels with the signal line pointing downside indicating sell which may be a pullback. An increase in the buyers’ pressure may break up $0.22 level and expose the price to $0.23 and $0.25 resistance levels. The price may decrease to $0.19 and $0.18 levels provided the support level of $0.20 does not hold.
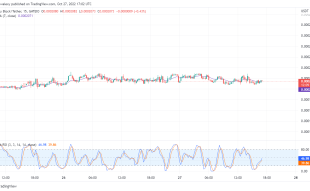
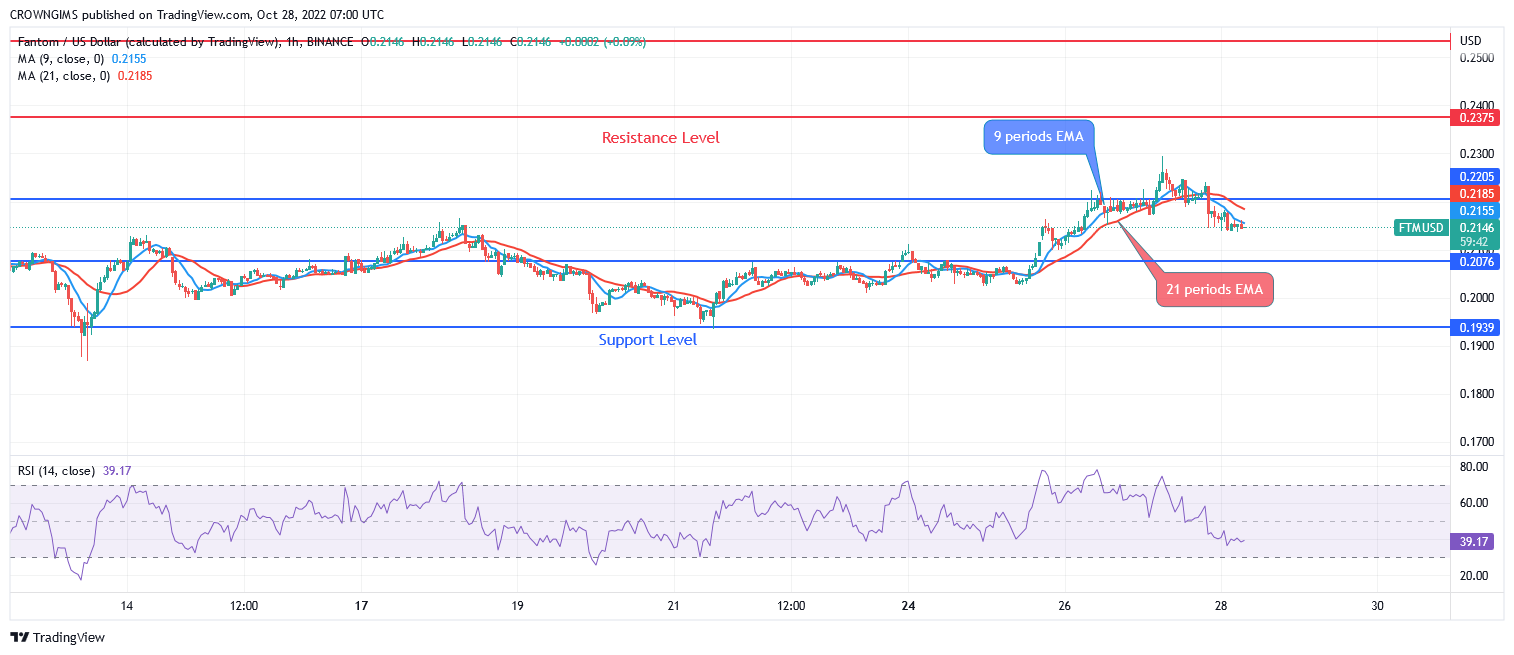
FTMUSD Medium-term Trend: Bearish
Fantom is on the bearish movement in the medium-term outlook. There is a formation of double bottom chart pattern at the support level of $0.19. This pattern triggered a bullish movement which broke up the resistance level of $0.20 and $0.22 level. The bears interrupts the bulls and the price is pulling back at moment.
The two EMAs are separated from each other and the price is trading below the two EMAs, indicating a bearish market. The Relative Strength Index period 14 is at 48 levels and the signal line pointing down which indicate a sell signal.
The IMPT token is increasing to $10 million within four weeks, it has been a fantastic presale. It indicate that Impact token is on its right way to reach first stage presale target of $10.8 million.
The Dash 2 Trade presale is currently soaring above $2m within short period of time, this is an excellent beginning. It is on the second stage of its nine stages with the price technically increasing on each stage. At the moment in second stage, the price is $0.05.
Related
Join Our Telegram channel to stay up to date on breaking news coverage