Join Our Telegram channel to stay up to date on breaking news coverage
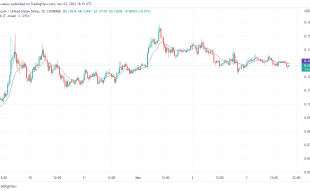
The Fantom price prediction faces the south after reaching the $0.28 high, further increases may hold as the coin touches $0.26 support.
Fantom Prediction Statistics Data:
- Fantom price now – $0.26
- Fantom market cap – $672.4 billion
- Fantom circulating supply – 2.5 billion
- Fantom total supply – 2.5 billion
- Fantom Coinmarketcap ranking – #67
FTM/USD Market
Key Levels:
Resistance levels: $0.35, $0.37, $0.39
Support levels: $0.16, $0.14, $0.12
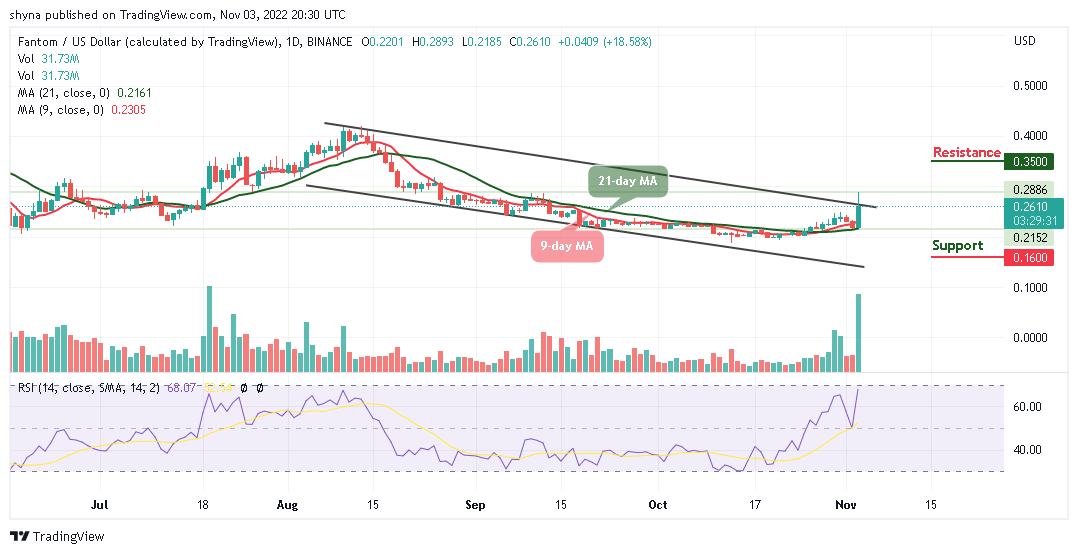
FTM/USD is seen to correct down after touching the resistance level of $0.28. However, given the sharp aggravation in price action, a breakout may no longer be explosive for the coin as the price is yet to stay above the upper boundary of the channel. Additionally, the Fantom price could fall more if the price retreats below the $0.21 support level.
Fantom Price Prediction: Fantom Price May Advance Further
The Fantom bulls are expected to cross above the upper boundary of the channel to keep the uptrends. Meanwhile, the first is to hold onto the support at $0.21 as this may help shift the attention back to the $0.28 resistance. Secondly, buyers need to focus their effort on breaking above the bullish flag pattern in anticipation of a rally massive enough to boost action above $0.30. Thirdly, the ongoing retreat from the upper boundary of the channel must be controlled to ensure that losses under $0.25 do not nullify the progress made in the last few days.
The technical indicator Relative Strength Index (14) moves to cross above the 70-level, indicating a bullish movement for the coin. However, if bears drag the current movement and bring the price below the 9-day and 21-day moving averages; FTM/USD could find its low at the support levels of $0.16, $0.14, and $0.12 respectively. Nevertheless, if the price breaks above the channel, it may likely hit the resistance levels of $0.35, $0.37, and $0.39.
Against Bitcoin, the Fantom price is hovering above the 9-day and 21-day moving averages. Therefore, if the selling pressure comes back into the market, FTM/BTC may likely create a new low but the technical indicator Relative Strength Index (14) is crossing above the upper boundary of the channel; traders may experience a negative move in the market if the 9-day MA crosses below the 21-day MA.
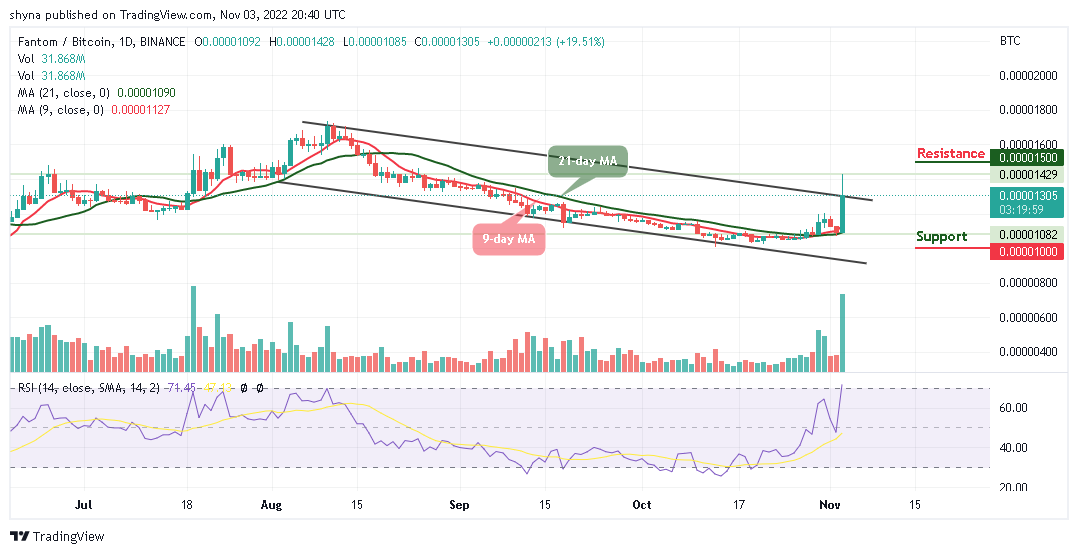
However, if the coin follows the downtrend, it could break to the downside to reach the support level of 1000 SAT and below. Meanwhile, if there is a bullish cross above the channel, the coin may reach the potential resistance level at 1500 SAT and above.
IMPT Getting More Popular
The IMPT presale raised over $12 million. The IMPT revolutionizes the concept of carbon credit. This is the perfect time to join the presale and enter the ground floor, as an IMPT token cost around $0.023.
Dash 2 Trade (D2T) Presale Getting Hotter
Dash 2 Trade raises over $4 million in its presale and reveals that LBANK Exchange will be the first CEX to sell its D2T token. The company hit that benchmark in recent weeks after launching its public token sale.
Related:
Join Our Telegram channel to stay up to date on breaking news coverage