

Join Our Telegram channel to stay up to date on breaking news coverage
The crypto market was flashing green on Friday with slight gains in prices across the board. Bitcoin was trading at $27,940, up 0.2% over the last 24 hours while XRP held above $0.511 with 2.85% gains on the day. Ethereum was the only non-stablecoin crypto among the top 10 digital assets by market capitalization. ETH was trading below $1,900 after losing 0.5% of its value in 24 hours.
With less than a week to go until the much-awaited Ethereum Shanghai and Capella upgrades scheduled for April 12, all eyes the ETH price to see how it will behave pre/post the event.
It's happening 🎊
Shapella is scheduled on mainnet for epoch 194048, scheduled for 22:27:35 UTC on Apr. 12, 2023 📆
Client releases compatible with the upgrade are listed in the announcement below 👇https://t.co/I0hSv9lnjz
— timbeiko.eth (@TimBeiko) March 28, 2023
The largest altcoin by market capitalization climbed above the $19,00 market for the first time since August 2022 hitting a 10-month high at $1,940 on Binance on April 5. Ethereum has since turned down and now trades 5% below this level at $1,853.
Nevertheless, Ethereum price is bullish despite the ongoing correction and is expected to lead other related altcoins in a rally ahead of the upgrades. Here are a number of reasons why.
Ether Tokens Staked In The ETH2 Deposit Contract Are Underwater
According to data from crypto research firm Delphi Digital reveals that Ethereum tokens staked in the ETH deposit contract have been locked since 2020 when the Beacon chain contracts were launched. It should be remembered that ETH price plummeted nearly 63% from its peak.
Therefore, the large volumes of the altcoin staked in the deposit contract are “underwater”, meaning they are sitting on unrealized losses.
According to the following chart by Delphi Digital on the state of staked Ether shows that tokens staked when the altcoins price was between $1,900 and $4,900 are currently underwater. Note that this segment represents a large volume of the staked crypto.
The Majority Of Staked ETH Is Underwater
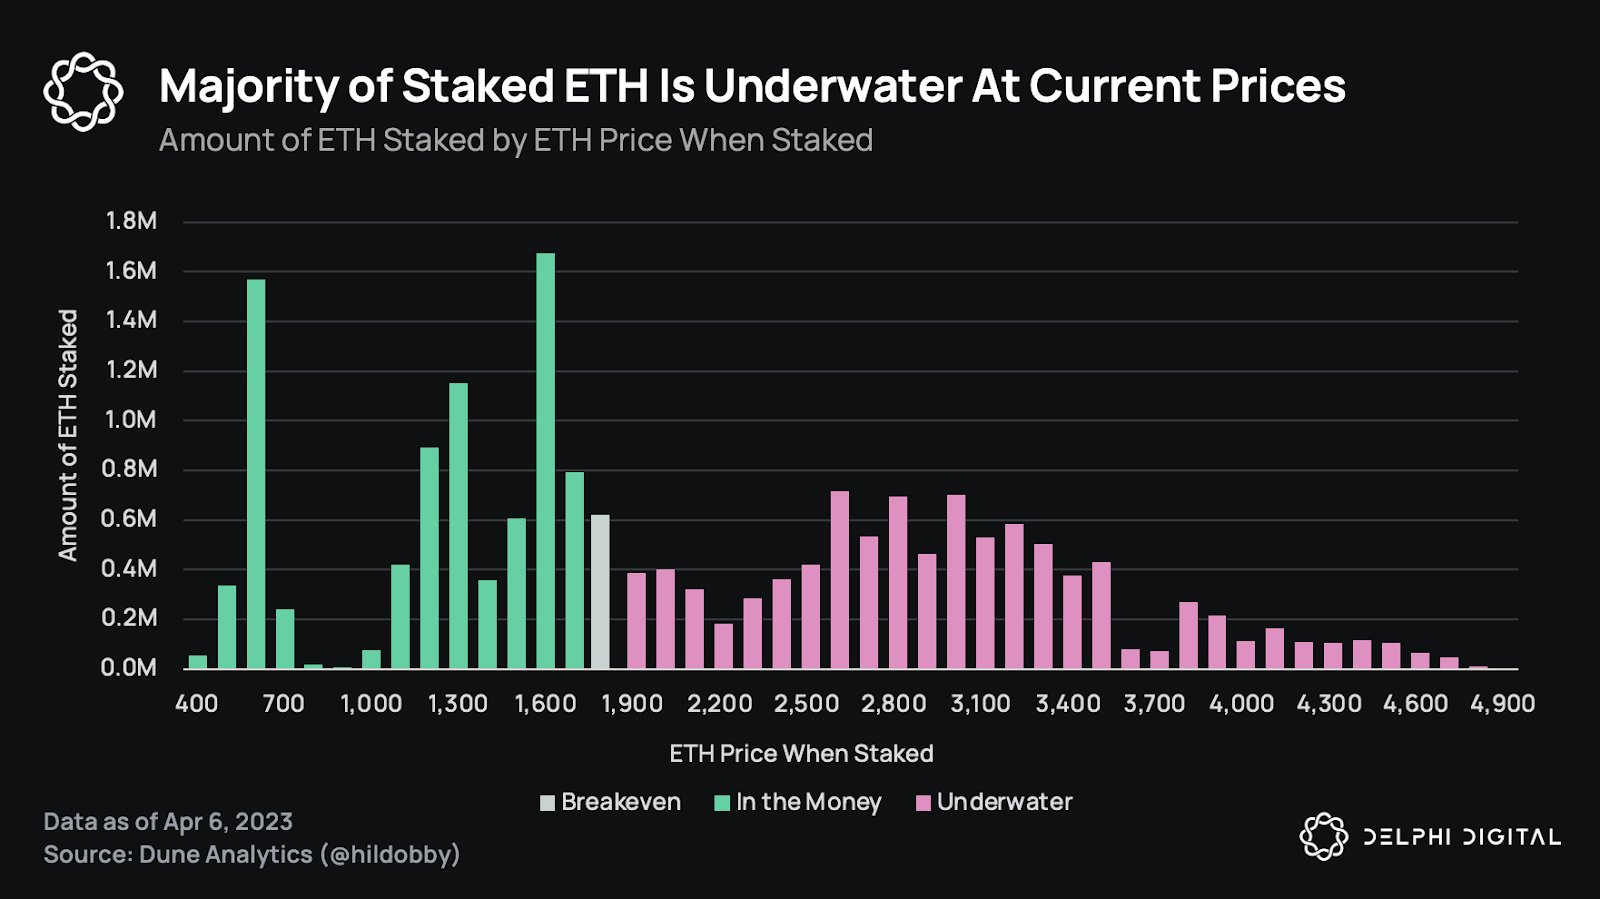
It is expected that the Shanghai hard fork will unlock the staked tokens. However, it is widely believed that the validators may not withdraw their staked assets not just because of the pending losses but also due to the minimum ETH required to be eligible as a validator. This fuels the narrative of the token unlock being a bullish event.
Multiple Positive Price Actions
According to data from TradingView and CoinMarketCap, the Ethereum price has posted impressive gains on the weekly, monthly, and quarterly timeframes despite the market volatility occasioned by the US banking crisis. ETH price is up 3.6% over the last week, 18.9% in the last 30 days and 46.3% over the last three months.
Ethereum price gains are also notable from the year-to-date perspective, recording 55.42% gains since the year began.
ETH has been on a steady uptrend since November 22 breaking key resistance levels on the daily timeframe. These include the $1,200 and the $,1,400 psychological levels, a major supply demand zone, now turned into support, stretching from $1,550 and $1,750, and the areas defined by the moving averages.
Most recently, Ethereum broke above the $1,900 mark reaching levels last seen in early August last year. This has led many analysts to believe that a trip to $3,000 may be possible by the end of Q2 2023.
🚨 $ETH Breaks $1,900
What will be #Ethereum’s highest price before the upcoming Shanghai upgrade? 🤔 pic.twitter.com/MLXYIfs4CO
— BitMart (@BitMartExchange) April 5, 2023
ETH Is Bullish On On-Chain Metrics
Ethereum on-chain metrics support a bullish case for the proof-of-stake (PoS) token in the near to medium terms. Ether whales have been accumulating over the recent weeks, according to data from Santiment. Its ETH supply distribution chart shows that the supply of Ether held by addresses with a 1,000-10,000 ETH balance (blue line in the chart) has grown by 0.5% in March.
Similarly, the 1 million-10 million ETH (brown) and the 10 million – 100 million ETH balance cohorts have witnessed 0.4% and 0.5% rises, respectively.
Ethereum Whale Accumulation
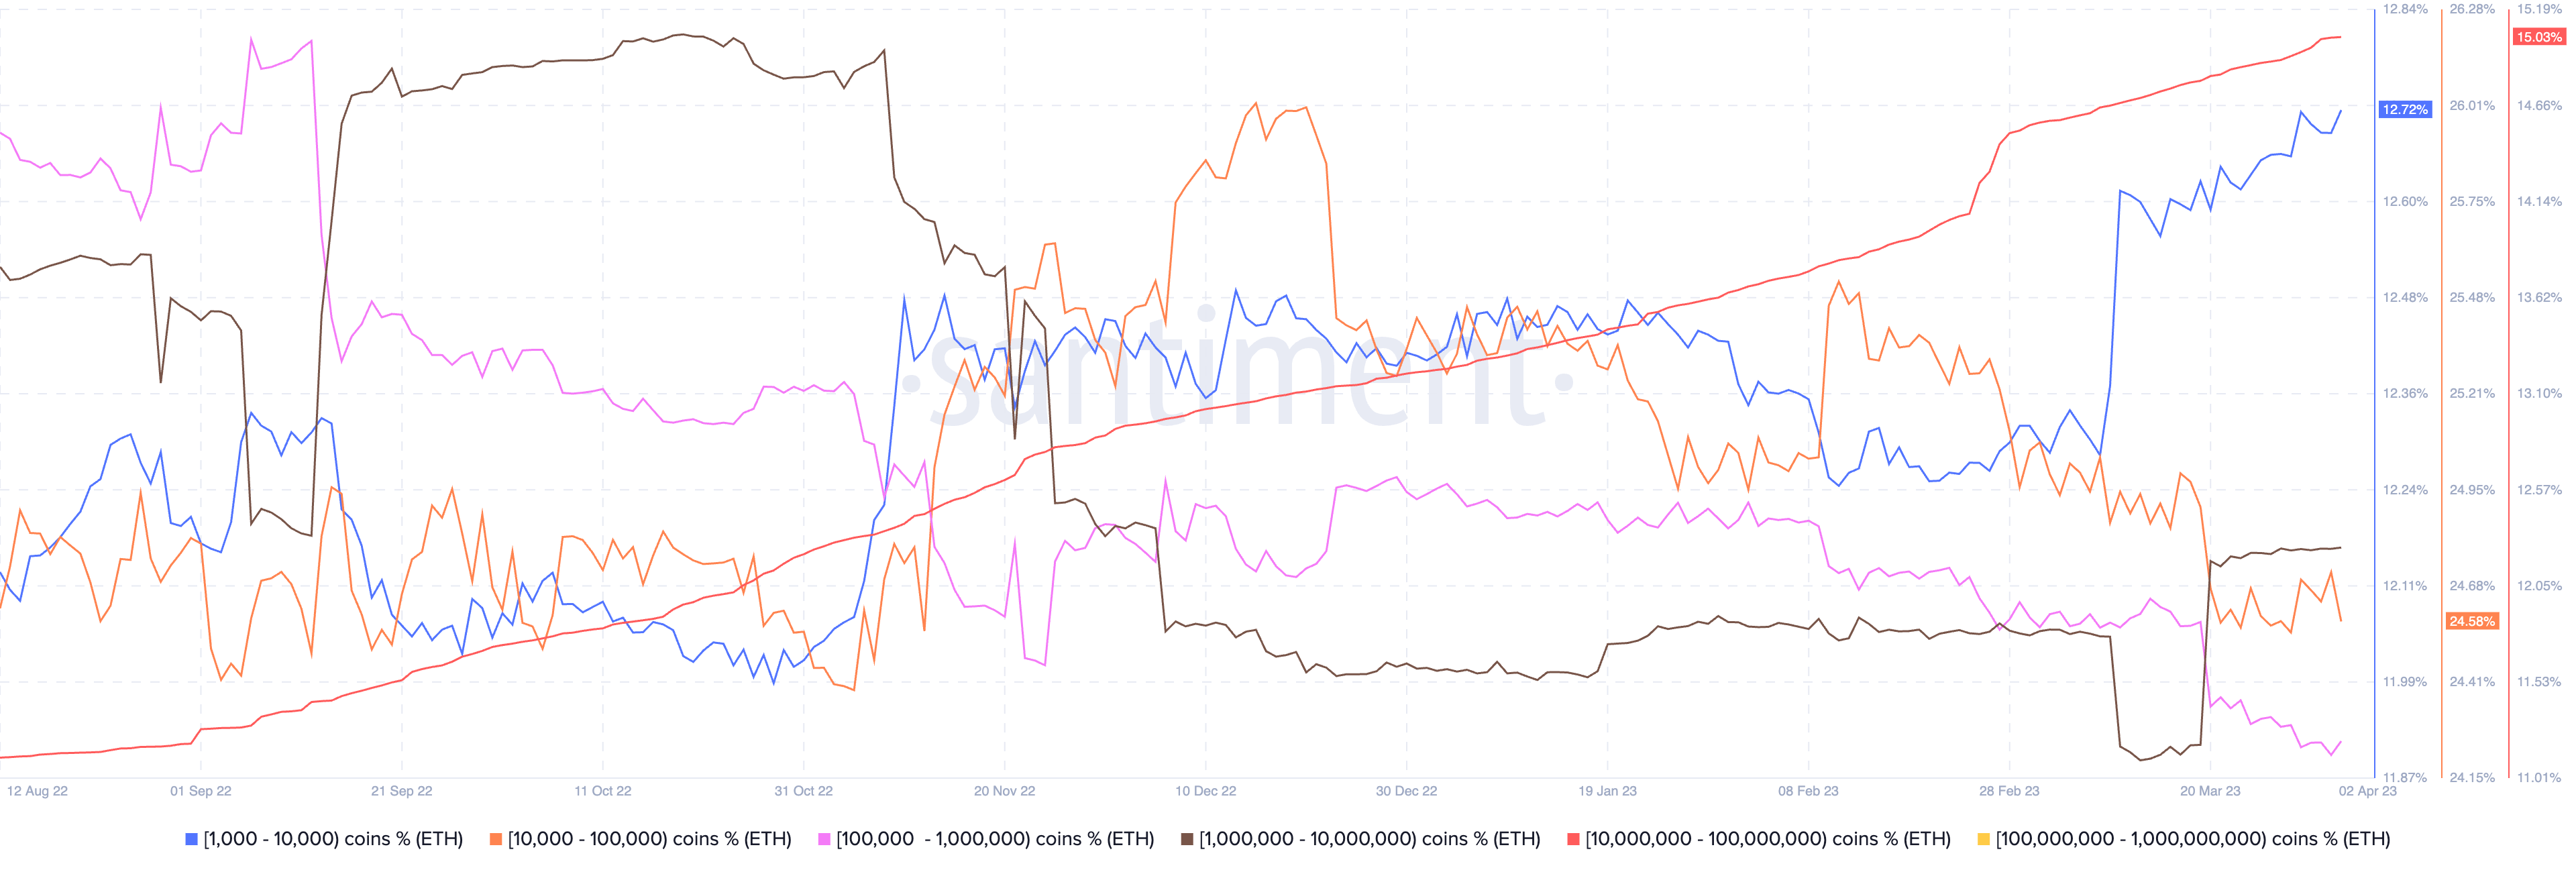
The growth appeared to be fueled by what looks like absorption of selling pressure introduced by the 100,000-1 million ETH (pink) and 10,000-100,000 ETH (orange) address cohorts. The growth could also be attributed to the network’s PoS contracts — directly or by using third-party stakers such as Lido DAO (LDO).
More data from Santiment reveals that Ethereum balance on exchanges has been declining. The blockchain data analytics firm posted a chart on Twitter saying, when the largest Ethereum addresses are split into exchange v. non-exchange, their balances “are moving in opposite directions.”
🐳 When splitting the largest #Ethereum addresses into exchange vs. non-exchange addresses, we can see them moving in opposite directions. The 10 largest exchange addresses are near #AllTimeLow levels, while the 10 largest non-exchanges continue ascending. https://t.co/fBBQSErETL pic.twitter.com/Xc0CdNITYF
— Santiment (@santimentfeed) April 6, 2023
Ether balance in the 10 largest known exchange wallets has hit all-time low levels while for 10 largest non-exchange addresses has continued its climb.
This signals accumulation by non-exchange players and a possible movement of crypto into self-custody. This contributes to a decline in selling pressure on Ethereum across crypto exchange platforms. A decline in selling pressure is a bullish sign for Ether’s price.
Total Value Locked On Ethereum Soars
According to data from DeFiLlama, the total value locked (TVL) on the Ethereum network has also been rising. This is partly because of increased staking on the Lido protocol, which accounts for 22.39% of all the value locked on the Ethereum network. Despite the TVL starting to drop in March due to regulatory and macro headwinds, the decentralized finance (DeFi) market seems to be recovering.
Ethereum Network TVL
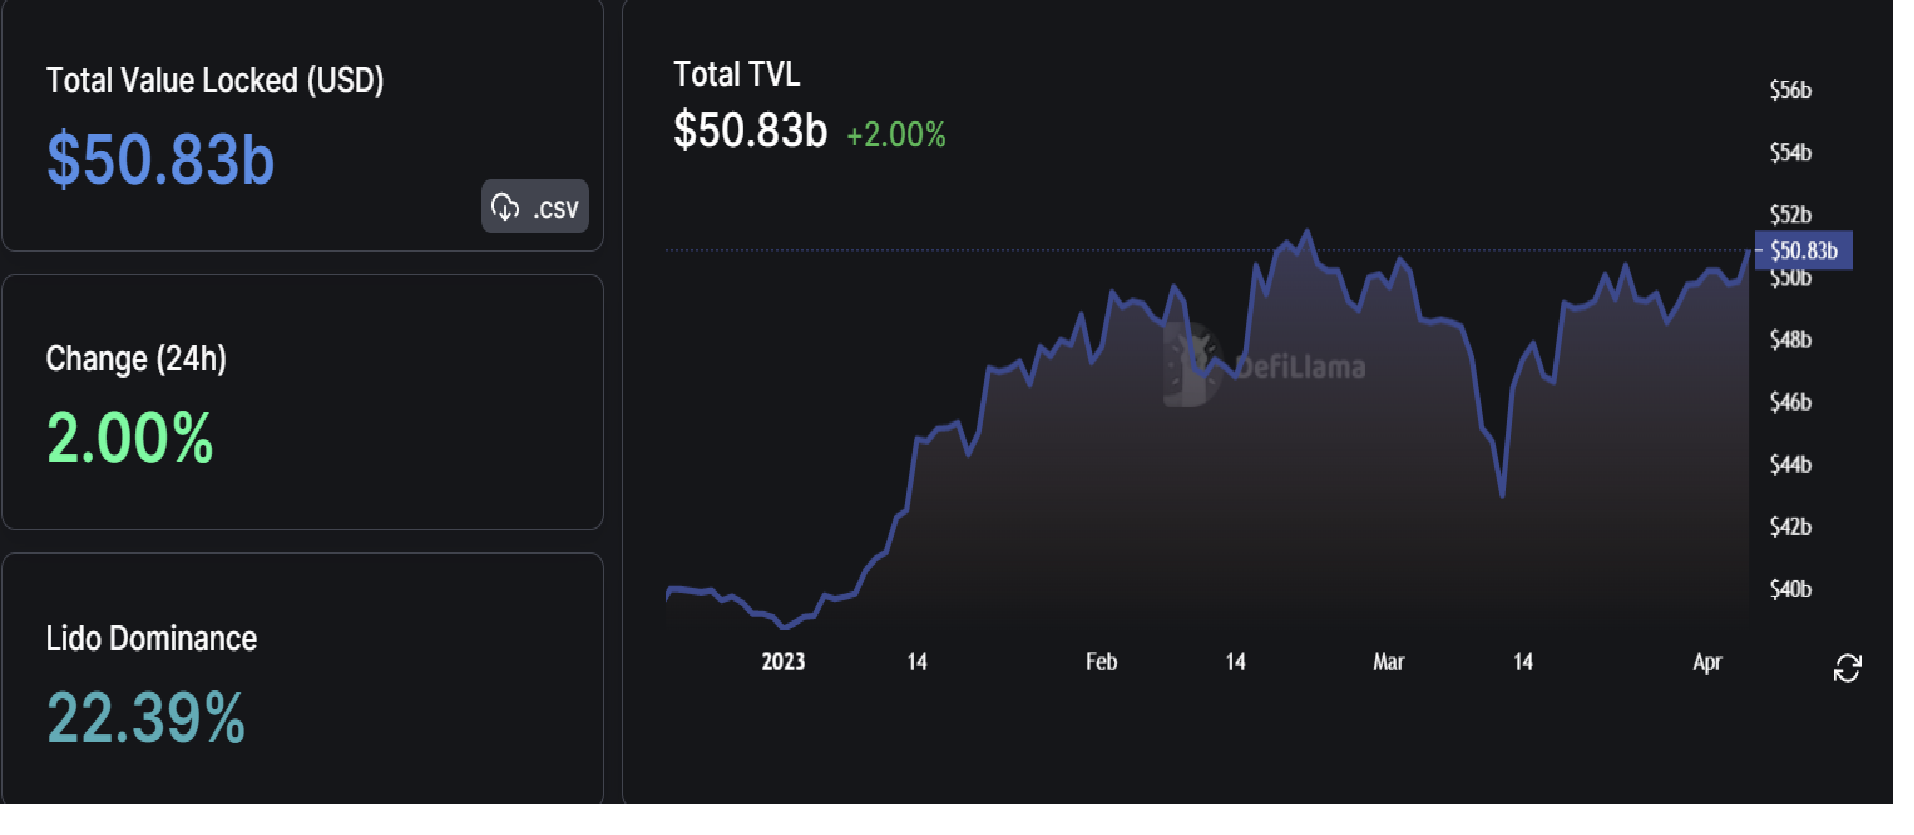
Ethereum’s TVL reached $50.8 billion on April 5, almost revisiting the yearly high of $51.4 billion reached on February 21.
Ethereum Price Technical Setup Points To More Upside
The technical setup of the ETH price on the daily timeframe shows that the upside is not over for the second most popular cryptocurrency. The Ether’s recent price action is similar to the one displayed between July 22 and August 13 when it bounced off the $1,420 support level to set a swing high at $2,030.
Therefore, if the same scenario plays out, Ethereum could rise from the current levels to reach the same levels as the one described above. This would represent a 9.71% uptick from the current price.
ETH/USD Daily Chart
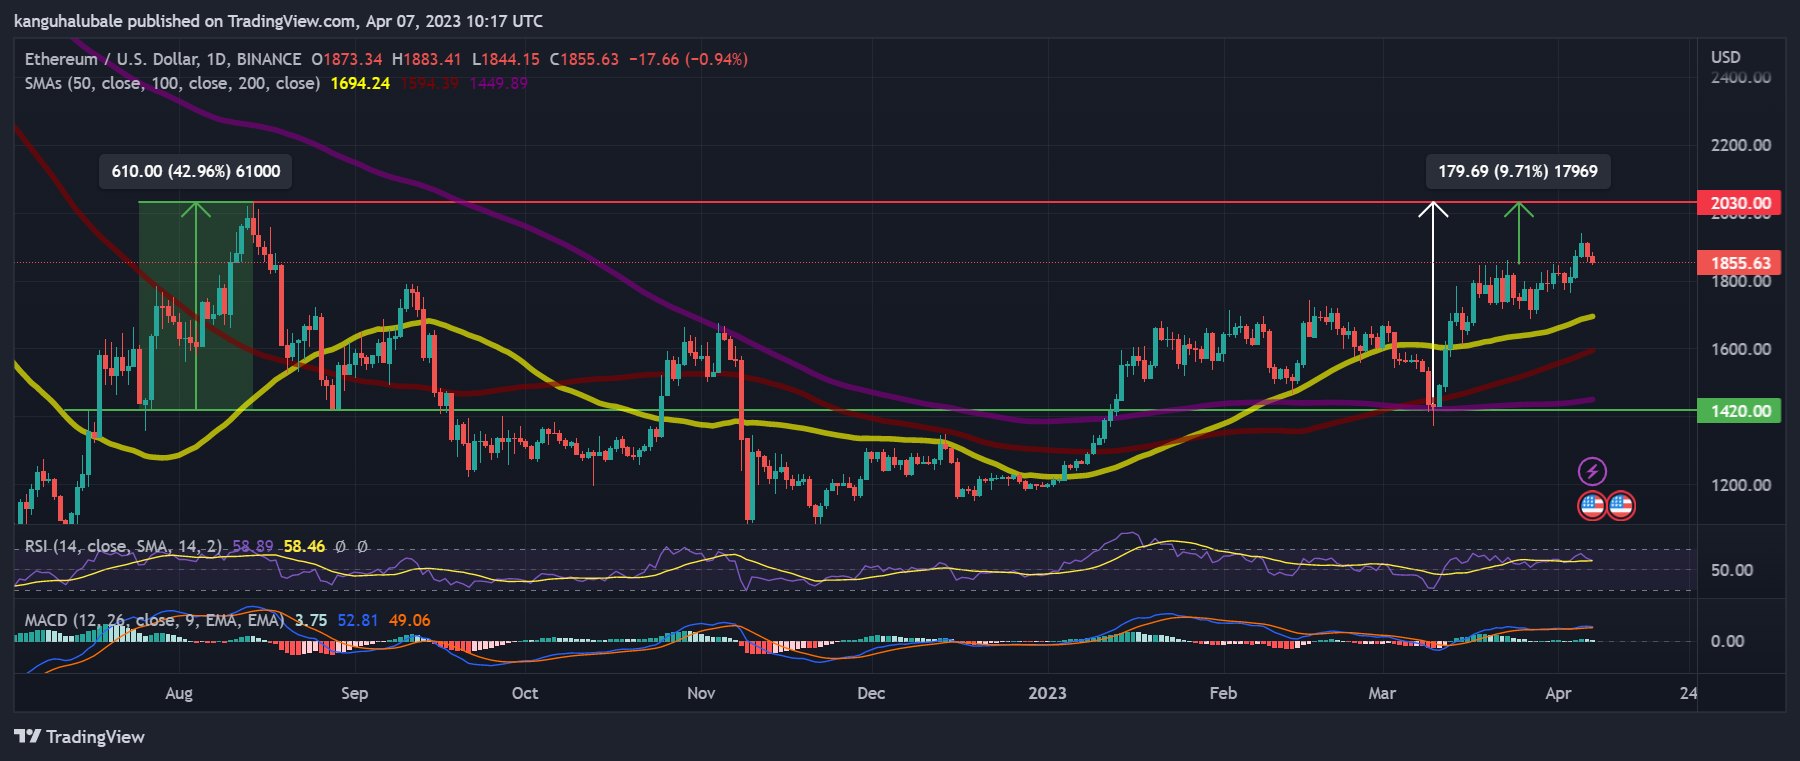
Several indicators supported Ether’s bullish outlook. To begin with, the moving averages were facing upward, an indication that the market conditions still favored the upside. In addition, these moving averages were moving below the price. This suggested that Ethereum sat on strong support downward and that demand pressure from these regions was likely to propel the price higher.
Moreover, the Relative Strength Index (RSI) was moving within the positive region above the midline. The value of this trend-following indicator at 58 suggested that there were more buyers than sellers in the market.
Furthermore, the Moving Average Convergence Divergence (MACD) indicator was also positioned in the positive region above the neutral line. Note that the call to buy Ethereum which was sent on April 4 when the 12-day Exponential Moving Average (EMA) crossed above the 26-day EMA was still in play, adding credence to the bullish outlook.
The strength of Ethereum’s price ahead of the Shanghai and Capella upgrades is clear on-chain through whale accumulation and a steady increase in staking. With only five days remaining until the event, traders expect continued volatility in ETH price.
On the flip side, Ethereum may drop from the current levels and drop below the $1,800 psychological level to tag the $1,700 support level. Below that, ETH may decline further to revisit the SMAs between the $1,400 and the $1,700 demand zone before eventually reaching the $1,200 defense line.
Related News:
- The Ethereum Archive Node service terminates, declaring success
- ETH Price Prediction: Ethereum’s Upward Trend Continues Above $1800. Can ETH Hit $2000?
- Arbitrum Airdrop: Arbitrum (Arb), Ethereum (Eth), And Tms Network (Tmsn) Are Set To Surge Soon
Join Our Telegram channel to stay up to date on breaking news coverage