Join Our Telegram channel to stay up to date on breaking news coverage
The ETH/USD market recently broke the $1300 mark from around $1.290. And at this point, we may conclude that some upside strength may be returning to this market.
ETH Analysis Statistics Data:
Ethereum value now: $1320.60
ETH’s market cap: $162.65 billion
Ethereum’s moving supply: 122.37 million
The Total supply of ETH: 122.37 million
Ethereum’s Coinmarketcap ranking: #2
To that effect we will further examine the ETH/USD and ETH/BTC market. This will supply traders with information to profitably manage their activities in this market.
Important Price Marks:
Resistance: $1320.60, $1350.00, $1380.00
Support: $1310.00, $1300.00, $1290.00
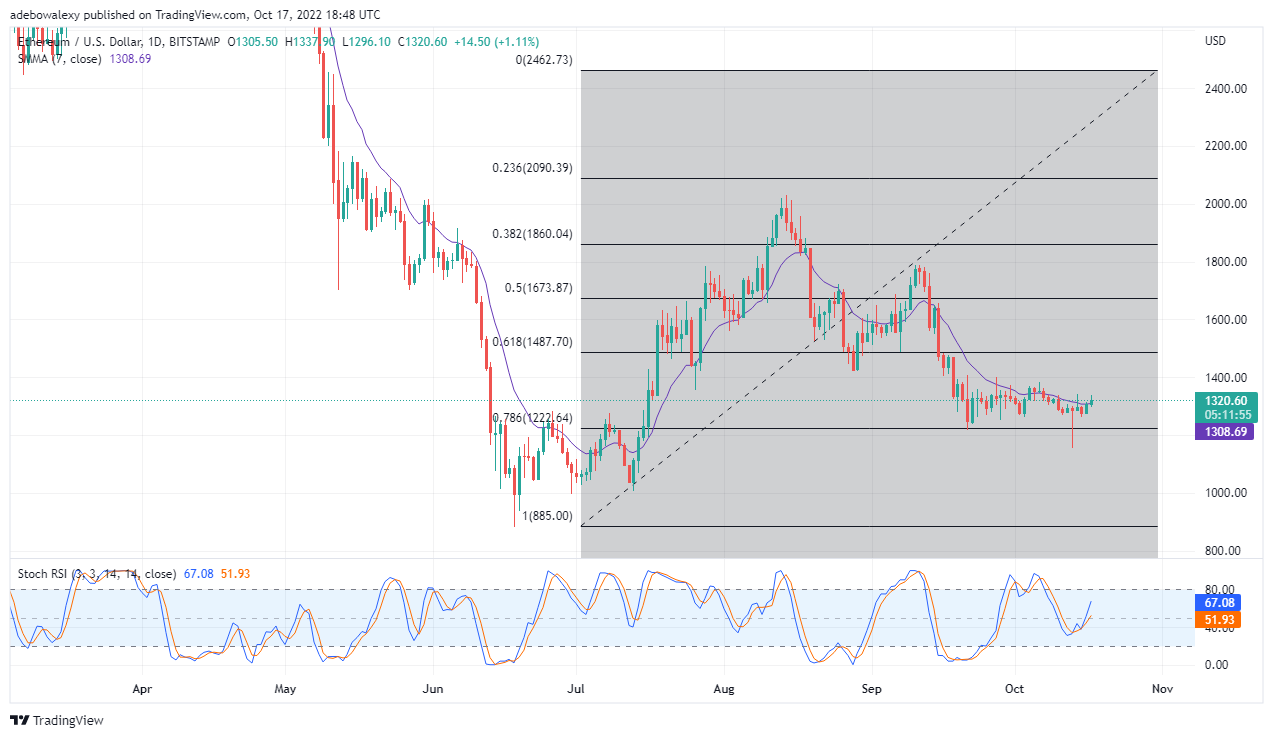
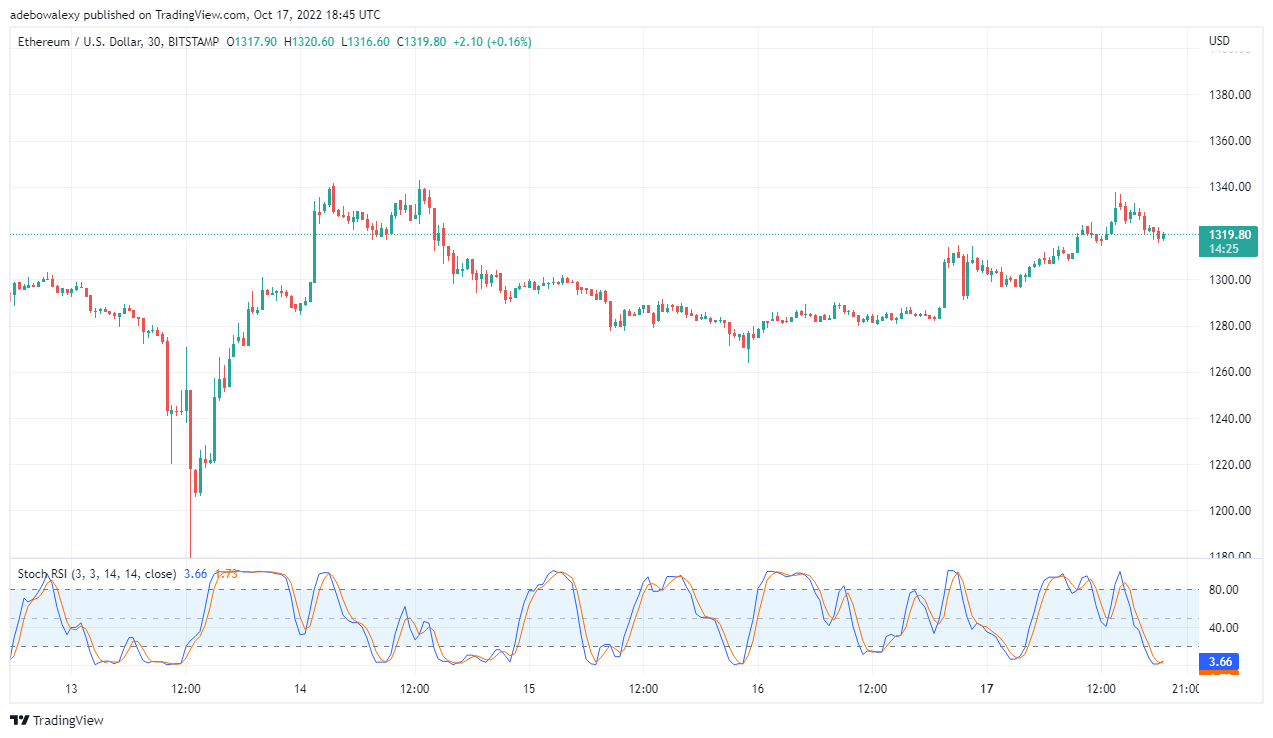
Ethereum Price Prediction Today, October 18, 2022: Is ETH/USD Going Bullish
Right from the previous trading session, ETH/USD price has been moving upwards. And now, it appears as if the SMA (Smooth Moving Average) is now acting as a strong support to the latest price candle here as it now sitting on it. Additionally, the Stochastic RSI is now moving upwards, and now above the 50% level, at 67% and 51.93%. Going by these signs we can say that the uptrend in this market is gradually gaining significant strength. And if the bulls retain control longer, price movement may soon break up the price level of $1380.
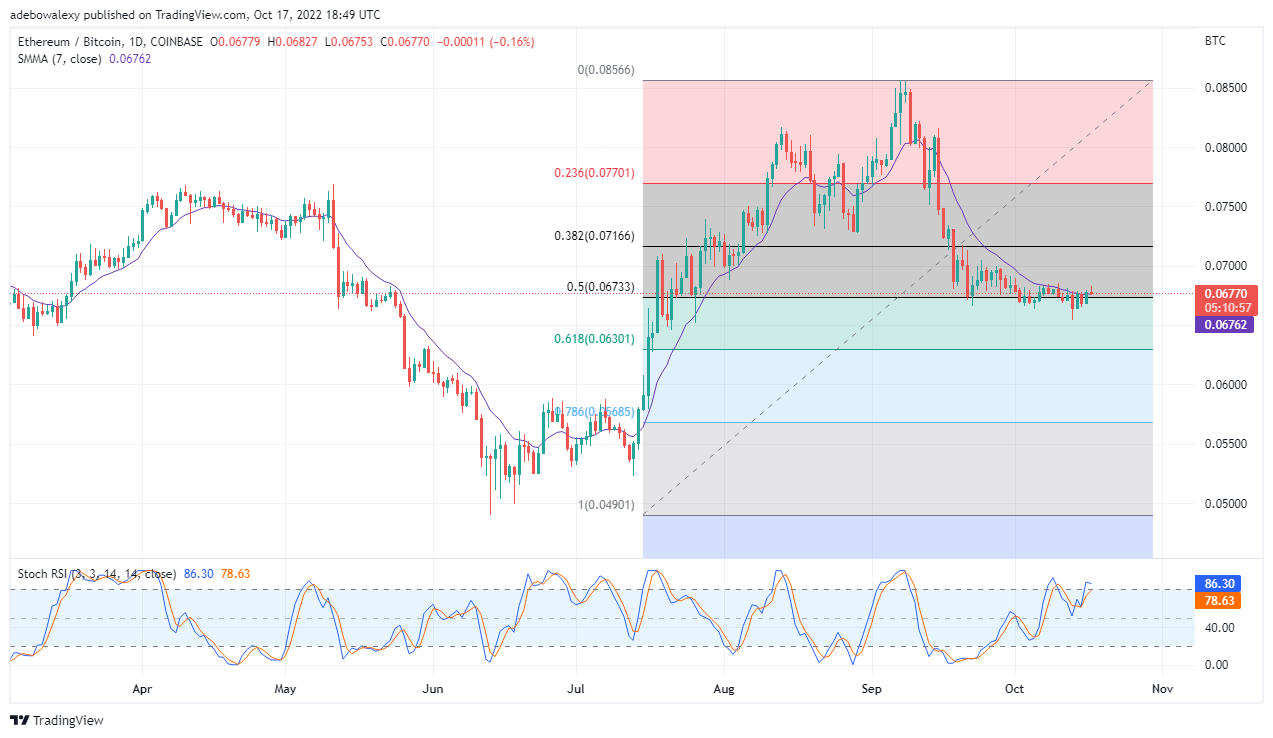
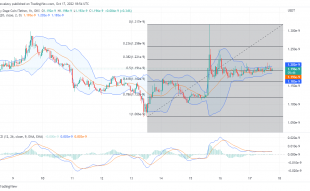
Ethereum Price Prediction Today, October 18, 2022: ETH/BTC Shapes to Retrace Downwards
Unlike what was witnessed in the ETH/USD market, ETH/BTC appears getting ready to retrace downwards. This can be seen as an inverted bearish hammer has just appearing above the SMA line. Consequently, this has brought the price in this market to fall to the same level as that of the SMA of 0.06770.
Also, the RSI curves after reaching the overbought region of 86% and 79% are now shaping to reverse the trend. If the two lines should eventually perform a bearish crossover, this may cause price action to break down the Fibonacci level 50 of price level 0.06733. However, traders can wait to see if the uptrend will continue to gather upward momentum, by placing a long other near 0.0685
Join Our Telegram channel to stay up to date on breaking news coverage