Join Our Telegram channel to stay up to date on breaking news coverage
The Ethereum price prediction shows that ETH could search for a new low as the market price heads to the south.
Ethereum Prediction Statistics Data:
- Ethereum price now – $1,300
- Ethereum market cap – $160 billion
- Ethereum circulating supply – 122.7 million
- Ethereum total supply – 122.7 million
- Ethereum Coinmarketcap ranking – #2
ETH/USD Market
Key Levels:
Resistance levels: $1700, $1800, $1900
Support levels: $1000, $900, $800
Your capital is at risk
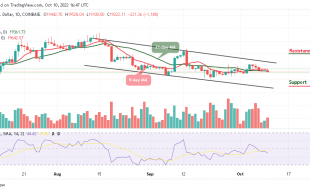
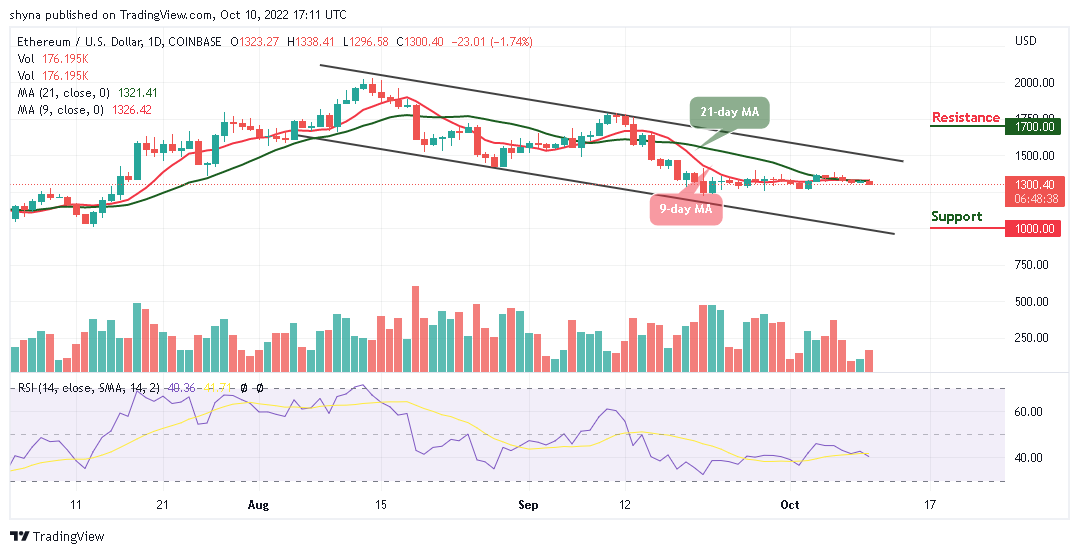
Looking at the daily chart, ETH/USD has been moving sideways for the past few days. The Ethereum price is likely to create more downtrends if it touches the $1,000 support. However, touching this support level may cause the second-largest crypto to correct higher, but it is likely to consolidate within the channel before heading to the north.
Ethereum Price Prediction: What to Expect from Ethereum (ETH)
As revealed by the daily chart, the Ethereum price is likely to break below the daily low at $1296 to gain more downtrends. Meanwhile, the Ethereum price is currently hovering at $1300, should it spike towards the lower boundary of the channel, the critical support levels of $1000, $900, and $800 may be tested and the technical indicator Relative Strength Index (14) may cross below the 40-level.
In other words, ETH/USD could either cross above the 9-day and 21-day moving averages or extend its decline toward the support level of $1200. On the upside, the next major resistance is near the $1500 level. But, the market price needs to hit the resistance levels at $1,700, $1,800, and $1,900 to move back into a positive zone. If not, there is a risk of more downsides below the channel.
When compares with Bitcoin, the daily chart reveals that the Ethereum price is ranging within the 9-day and 21-day moving averages. If the price crosses above the resistance level of 7000 SAT, there is a possibility that additional benefits may be obtained in the long term as the next resistance is close to the 7500 SAT level. Therefore, if the price of the coin rises, it could break the potential resistance level of 8060 SAT and above.
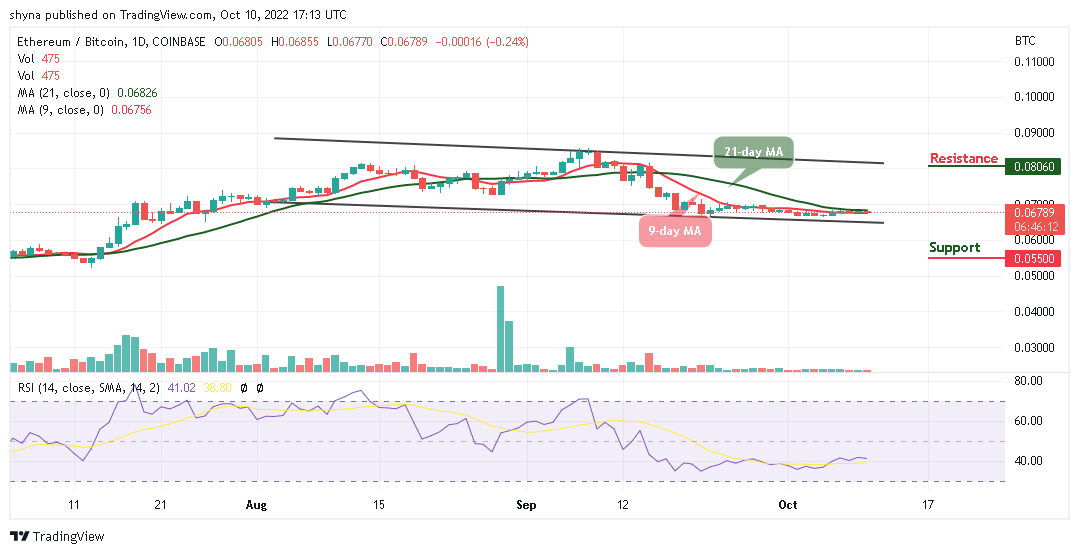
Moreover, if the sellers bring the price below the lower boundary of the channel, 6000 SAT support may play out before rolling to the critical support at 5500 SAT and below. The Relative Strength Index (14) is moving in the same direction above the 40-level, suggesting sideways movement.
Join Our Telegram channel to stay up to date on breaking news coverage