
Join Our Telegram channel to stay up to date on breaking news coverage
The Ethereum price prediction reveals that ETH faces key support as the market price heads to the downside.
Ethereum Prediction Statistics Data:
- Ethereum price now – $1044
- Ethereum market cap – $127.0 billion
- Ethereum circulating supply – 121.5 million
- Ethereum total supply – 121.5 million
- Ethereum Coinmarketcap ranking – #2
ETH/USD Market
Key Levels:
Resistance levels: $1800, $2000, $2200
Support levels: $400, $300, $200
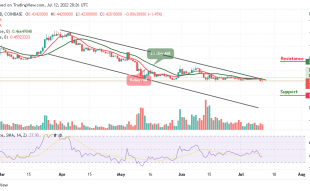
As the market opens today, ETH/USD drops with a bearish bias as the coin heads toward the support level of $1000. For the past few days, the Ethereum price did start a nasty decline and has been breaking many supports. The market price could correct higher, but it is likely to face more sellers on its way towards the lower boundary of the channel.
Ethereum Price Prediction: Ethereum (ETH) Ready Faces the South
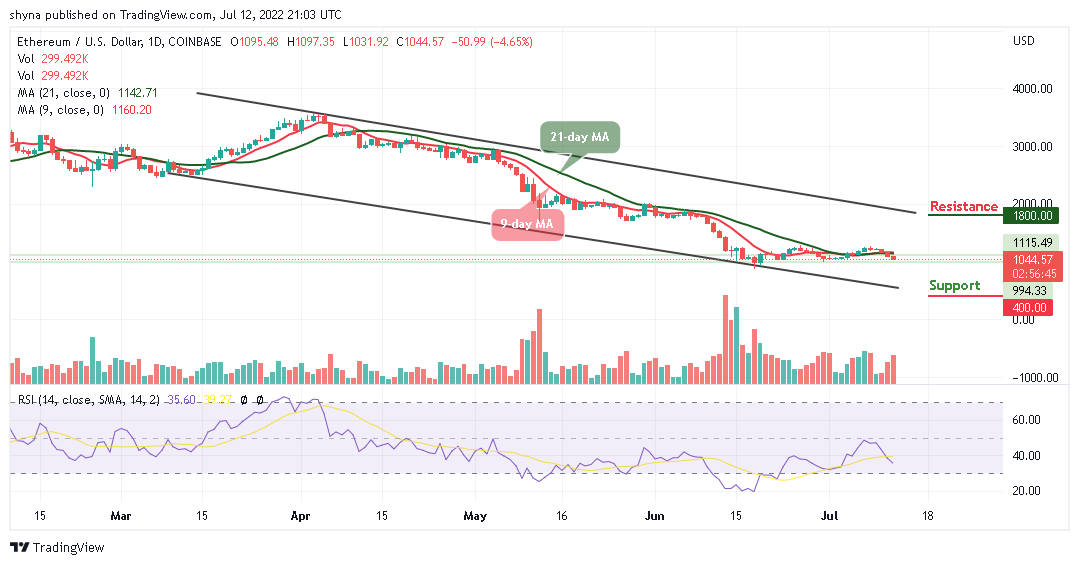
Looking at the daily chart, the Ethereum price is breaking to the downside, and it is likely for the coin to break down heavily to gain more downtrends. However, should it spike below the channel, the critical support levels of $400, $300, and $200 may be reached as the technical indicator Relative Strength Index (14) moves to cross into the oversold region.
More so, ETH/USD could either recover above the 9-day and 21-day moving averages or extend its decline towards the support level of $900. On the upside, the next major resistance could be found near the $1500 level. Meanwhile, the price needs to climb above the $1800, $2000, and $2200 resistance levels to move back into a positive zone. If not, there is a risk of more downsides below the channel.
When compared with Bitcoin, the daily chart reveals that the Ethereum price is hovering below the 9-day and 21-day moving averages. If the price crosses above the moving averages, there is a possibility that the coin may begin an upward trend but the next resistance key above this level is close to the 6000 SAT level. Therefore, if the price rises, it could even break the 6500 SAT and above in future sessions.
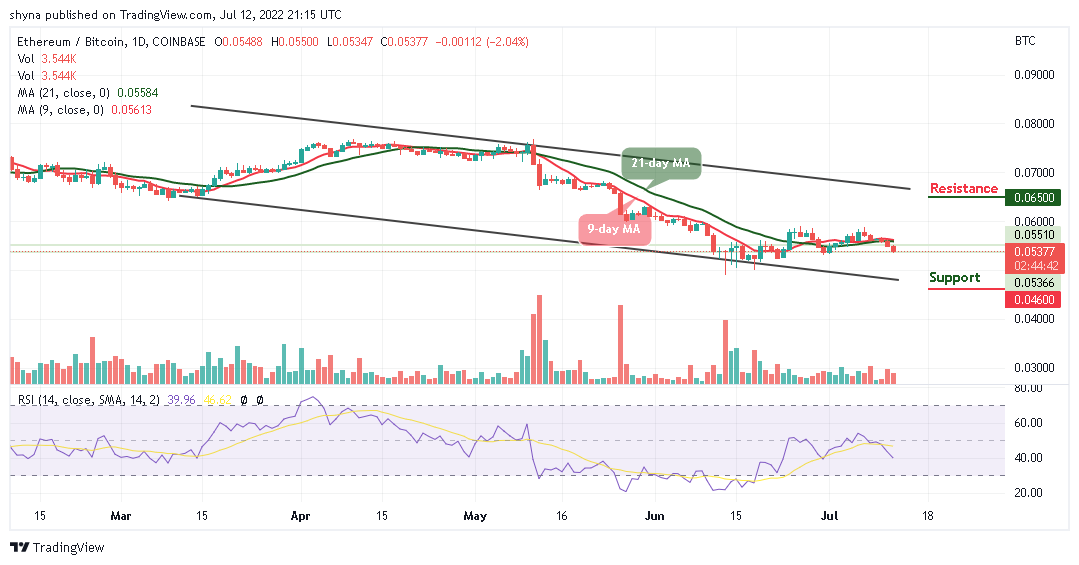
However, if the bears push the price towards the lower boundary of the channel, 5000 SAT support may play out. Any further bearish movement could bring the coin to the critical support at 4600 SAT and below as the Relative Strength Index (14) is likely to cross below the 40-level, suggesting bearish signals.
Join Our Telegram channel to stay up to date on breaking news coverage