

Join Our Telegram channel to stay up to date on breaking news coverage
ETH Price Prediction – March 1
Ethereum (ETH) is diving below the key supports and it may continue to move down towards $205 if it fails to stay above $230.
ETH/USD Market
Key Levels:
Resistance levels: $265, $270, $275
Support levels: $175, $170, $165
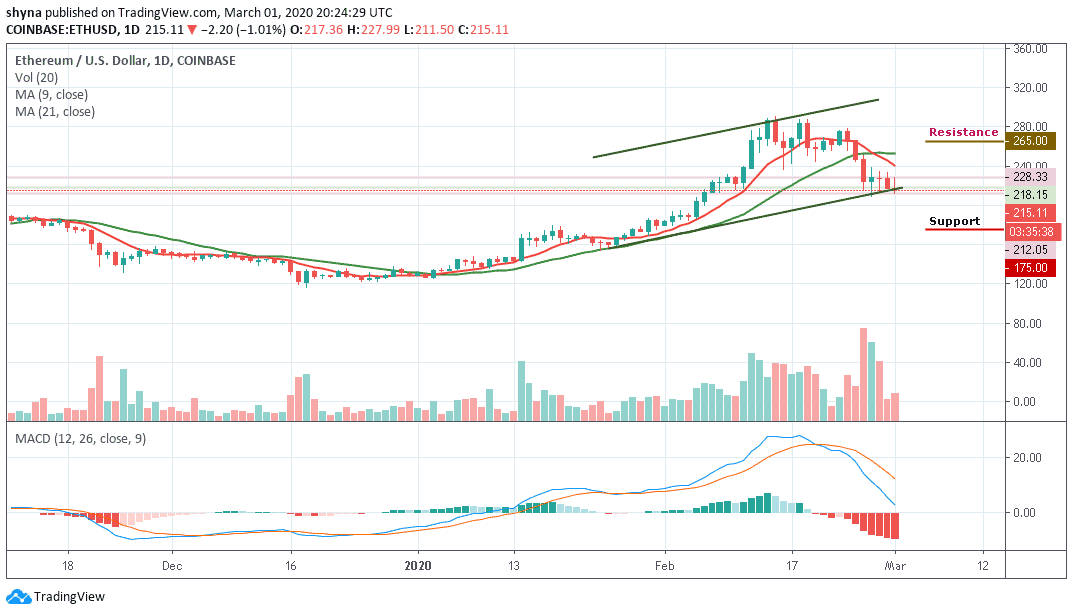
ETH/USD has jumped from $218.15 to touch the intraday high at $228.33 in a matter of hours. The crypto has retreated to $215.11 at the time of writing. Meanwhile, the buyers blamed the $230 critical support for boosting bears’ pressure on the market and several areas of support have failed, including $225 and $220. However, the support areas of between $215 and $210 have been well established.
Looking at the daily chart, ETH/USD is trading below the 9-day and 21-day moving averages at $215 at the time of writing, trying to recover from the intraday low of $212.05. The second-largest crypto in the coin market cap, with a current market value of $24.24 billion, has lost 1.01% of its value since the beginning of today and has remained virtually unchanged from day-to-day.
Moreover, the Ethereum price continues to follow the downtrend but still within the channel and any attempt to break below the channel, the bears may reach the nearest support at $175, $170 and $165 levels. Conversely, if the bulls push the price above the moving averages and maintain the upward movement within the channel, the buyers may find resistance at $265, $270 and $275. In other words, the MACD indicator is making an attempt to move into the negative side, which indicates more bearish signals.
Against Bitcoin, the market price remained in the ascending channel as the coin may begin to move in sideways. ETH/BTC is currently trading at the level of 0.0252 BTC and the bulls couldn’t push the price above the 9-day and 21-day moving averages. Looking at the chart, if the market continues to drop, the next key supports may likely be at 0.0220 BTC and below.
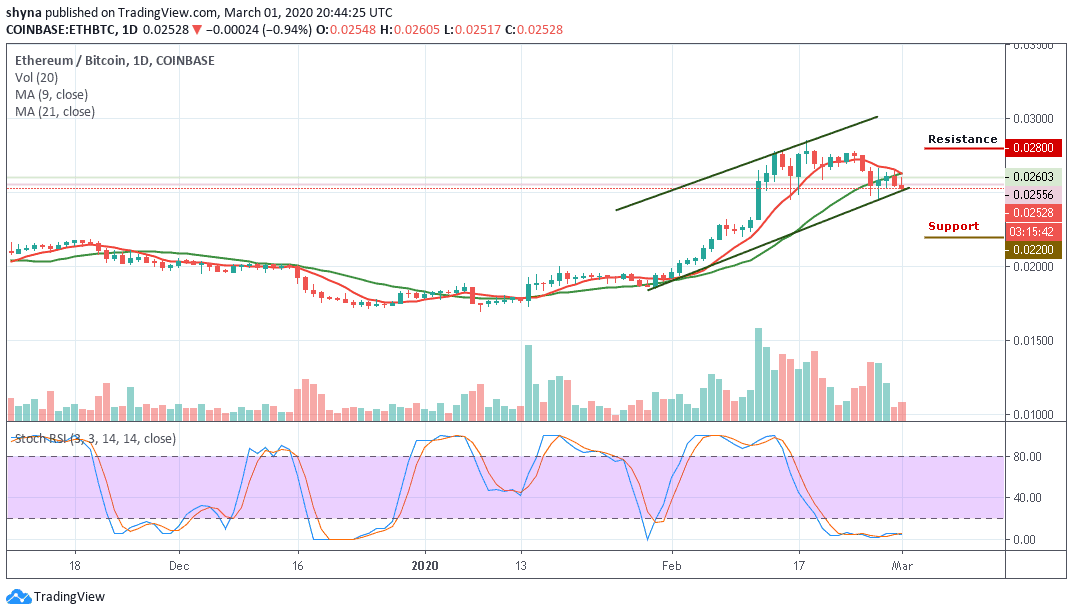
However, on the upside, a possible bullish movement may likely push the market above the moving averages, when this is done, the resistance level of 0.0280 BTC and above may be visited. The stochastic RSI is still within the oversold zone and this indicates that the market may continue to fall.
Please note: Insidebitcoins.com is not a financial advisor. Do your research before investing your funds in any financial asset or presented product or event. We are not responsible for your investing results.
Join Our Telegram channel to stay up to date on breaking news coverage
