Join Our Telegram channel to stay up to date on breaking news coverage
Bitcoin (BTC) Price Prediction – March 01
There has been no significant price movement in the last 48 hours. BTC/USD price has been stuck above $8,500 price level. The bears fail to reach the support levels of $8,400 and $8,200 where the price can rebound.
Key Levels:
Resistance Levels: $10,000, $11, 000, $12000
Support Levels: $7000, $6000, $5000

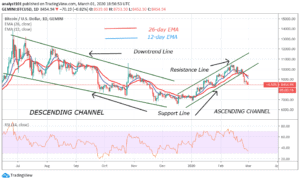
Bitcoin has been consolidating above $8,500 for the past five days. Expectantly, the price breakout or breakdown is imminent. The bears could not reach the lows of $8,400 and $8,200 where the bulls could have a surprise rebound. A rebound above the low of $8,200, will push the price to rally above $9,200. Early February, the bulls were resisted at $10,200; BTC fell to the low of $9,800 and rebounded. The price moves up and broke the current resistance to reach $10,400 overhead resistance. In the current dispensation, the market is still in consolidation. A possible rebound cannot be ruled out.
Assuming, after consolidation, a price breakout occurs that breaks the $9,200 resistance. This current resistance will turn to support making the price to move up. Nonetheless, Bitcoin is currently at level 35 of the Relative Strength Index period 14. The coin is in the downtrend zone. It is below the centerline 50 which indicates that it may fall.
BTC/USD Medium-term Trend: Ranging (4-Hour Chart)
On the 4-hour chart, price consolidation is ongoing between $8,400 and $8,800. It appears the bears are breaking the $8,400 support. The constant testing of the support has weakened it thereby giving the bears the advantage to break below.
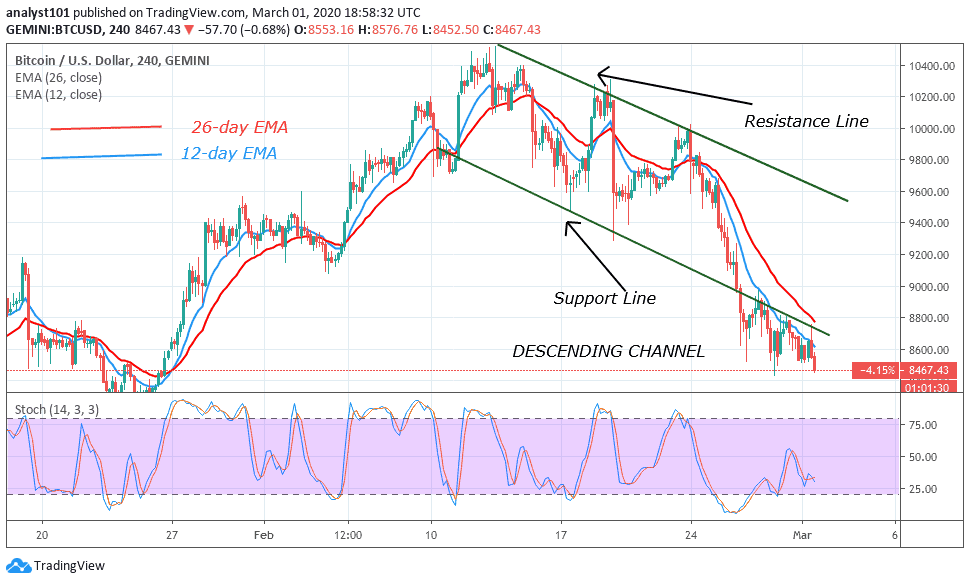
On the other hand, the bulls will have the advantage to rebound. The 12-day EMA is acting as resistance to the coin. The coin is trading above 25% of the daily stochastic. At the moment, the coin is in a bullish momentum but the stochastic bands are fluctuating.
Please note: Insidebitcoins.com is not a financial advisor. Do your research before investing your funds in any financial asset or presented product or event. We are not responsible for your investing results.
Join Our Telegram channel to stay up to date on breaking news coverage