Join Our Telegram channel to stay up to date on breaking news coverage
ETH Price Prediction – May 15
Currently, the price to buy Ethereum is facing a fresh round of selling. The coin remains at a risk of more downsides if it breaks below the channel.
ETH/USD Market
Key Levels:
Resistance levels: $230, $235, $240
Support levels: $160, $155, $150
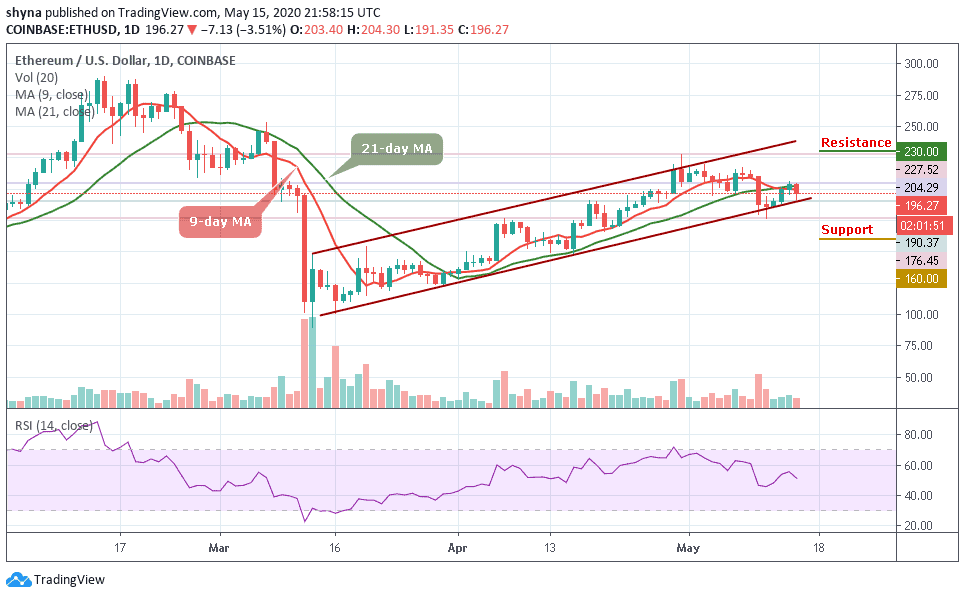
Looking at the daily chart, Ethereum is currently seen trading below the 9-day and 21-day moving averages. The trading session of a few days ago reveals that the Ethereum price was trading around its usual resistance level at $200, from where it rose to more than $205. Nevertheless, before the end of the day, ETH mounted as high as $206.86 just to start plunging today falling drastically to touch the low of $190.37.
However, ETH/USD is trading at $196.27 at the time of writing, having trying to recover from the intraday low of $190.37. The second-largest crypto in the coin market cap, with a current market value of $21.78 billion, has lost 3.51% of its value since the beginning of today. Similarly, the RSI (14) is moving below level 40, which indicates that the bears are coming up.
Moreover, the Ethereum price continues to follow the downtrend but still within the channel and any attempt to break below the channel, the bears may hit the support at $160, $155, and $150 levels. More so, if the bulls push the price above the moving averages and maintain the upward movement towards the channel, the buyers may likely find resistance at $230, $235, and $240.
Comparing with Bitcoin, the Ethereum market price remained in the descending channel as the bears dominate the market. ETH/BTC is currently trading at 0.0208 BTC and the bulls couldn’t push the price above the 9-day moving average. Looking at the chart, if the market continues to drop, the next key supports may likely be at 0.0180 BTC and below.
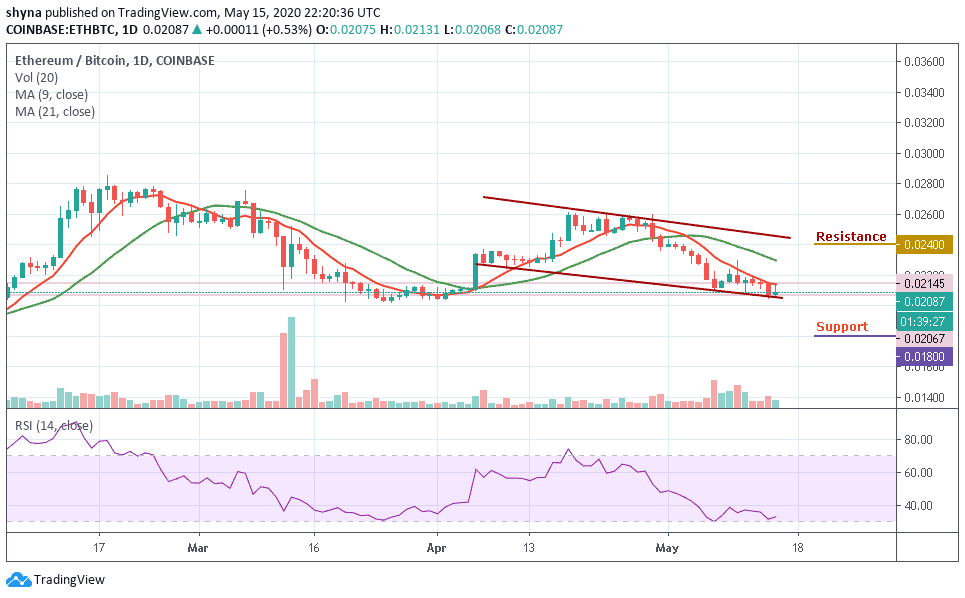
However, on the upside, a possible bullish movement may likely push the market above the moving averages, when this is done, the resistance level of 0.0240 BTC and above could be visited. The RSI (14) is moving below 40-level and this may determine the next direction that the market will follow.
Please note: Insidebitcoins.com is not a financial advisor. Do your research before investing your funds in any financial asset or presented product or event. We are not responsible for your investing results.
Join Our Telegram channel to stay up to date on breaking news coverage