Join Our Telegram channel to stay up to date on breaking news coverage
ETH Price Prediction – April 12
Ethereum bulls push through the $160 resistance but still fall short of $170.
ETH/USD Market
Key Levels:
Resistance levels: $200, $205, $210
Support levels: $128, $123 $119

The recent bullish action of ETH/USD failed to sustain gains above $170 level, although a high was achieved at $165.09. For the past few days, Ethereum consolidated the accrued gains between $155 and $160 but the bullish wave across the board today placed ETH/USD on a recovery trajectory, pulling the price above the critical $160 level.
Currently, Ethereum is trading at $165.09 after adding 4.12% onto its value on the day. The strength of the coin is opening the door for a massive recovery movement targeting $175. Meanwhile, the critical resistance at $175 must come up to pave the way for the impending action. From a technical perspective, ETH/USD is capable of tackling the hurdles towards $200, $205 and $210 resistance levels as the RSI (14) shows a bullish sign.
Therefore, the bulls still have room for growth in the short term. On the downside, if there are fresh declines and the bulls struggle to hold the $140 support. So, traders should be alert for various support levels including $135 and $130. Other key support levels include $128, $123 and the critical $119.
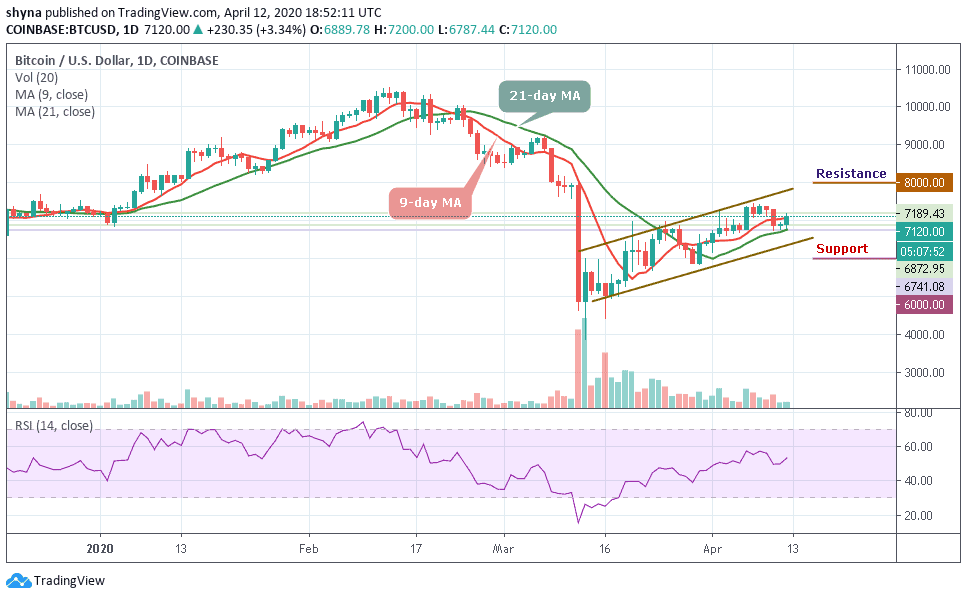
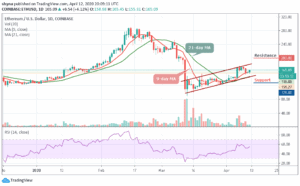
When compared with BTC, Ethereum (ETH) is currently changing hands at 0.0229 BTC following a bearish moment at the time the market opens today. Looking at the daily chart, the current trend of the coin is perpetually looking bearish in the short-term, moving above the 9-day and 21-day moving averages within the descending channel.

Meanwhile, the resistance levels to look for are 0.025 BTC and 0.026 BTC while the closest support levels to keep an eye on are 0.021 BTC and critically 0.020 BTC. The RSI (14) is moving around 56-level, which could continue to give bearish signals in the nearest term.
Please note: Insidebitcoins.com is not a financial advisor. Do your research before investing your funds in any financial asset or presented product or event. We are not responsible for your investing results.
Join Our Telegram channel to stay up to date on breaking news coverage