Join Our Telegram channel to stay up to date on breaking news coverage
Bitcoin (BTC) Price Prediction – April 12
Bitcoin price is trading nicely above the $7,000 and the coin must climb above the $7,500 resistance to continue the bullish movement.
BTC/USD Long-term Trend: Bullish (Daily Chart)
Key levels:
Resistance Levels: $8,000, $8,200, $8,400
Support Levels: $6,000, $5,800, $5,600
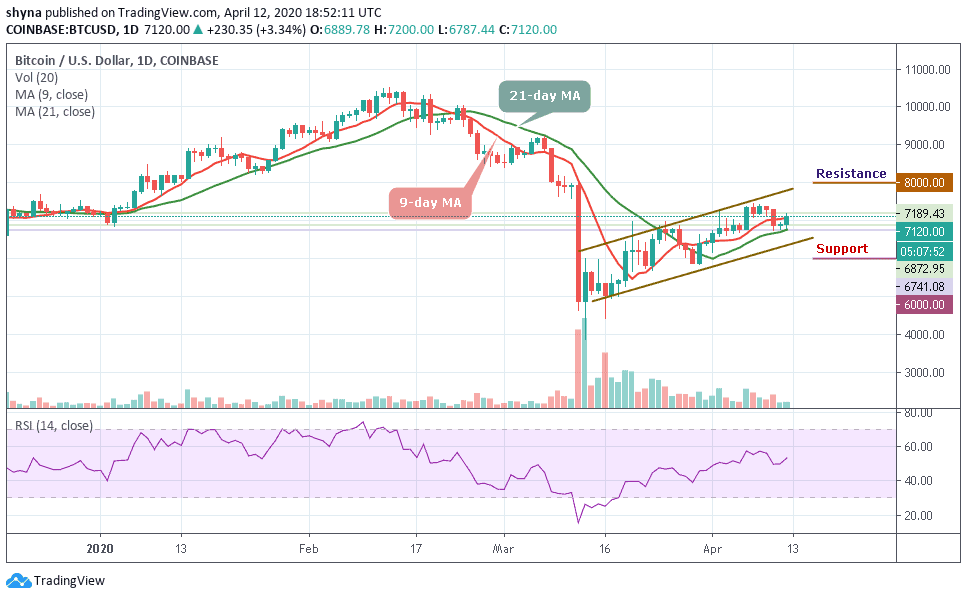
BTC/USD started the day with a downside movement as many coins started moving the same direction as well, but later, the Bitcoin market started improving. Within the first few hours after the daily trading started, BTC/USD has moved up from $6,741.08 to $7,189.43 and now changing hands at $7,120.
More so, BTC/USD is struggling to climb higher above the $7,200 resistance as the coin is settling in a tight range between $6,741 and $7,189 above the 9-day and 21-day moving averages. Typically when the new uptrend movements are beginning to form, buyers will use the moving averages as the nearest support levels. As much as the red-line of 9-day MA is above the black-line of 21-day MA, the market could still remain in the upward movement.
Moreover, if the market decides to go down, Bitcoin’s price may drop to $6,500 and should this support fails to contain the sell-off, we may see a further drop to $6,000, $5,800 and critically $5,600. The resistance levels to watch are $8,000, $8,200 and $8,400 respectively. Meanwhile, the technical indicator RSI (14) moves above 52-level, suggesting more bullish signals.
BTC/USD Medium-Term Trend: Bearish (4H Chart)
Looking at the 4-hour chart, the bears have been dominating the market for the past few days now, but the bulls are trying to step back into the market to defend the $7,000 level. If not, the $6,800 and below may come into play.
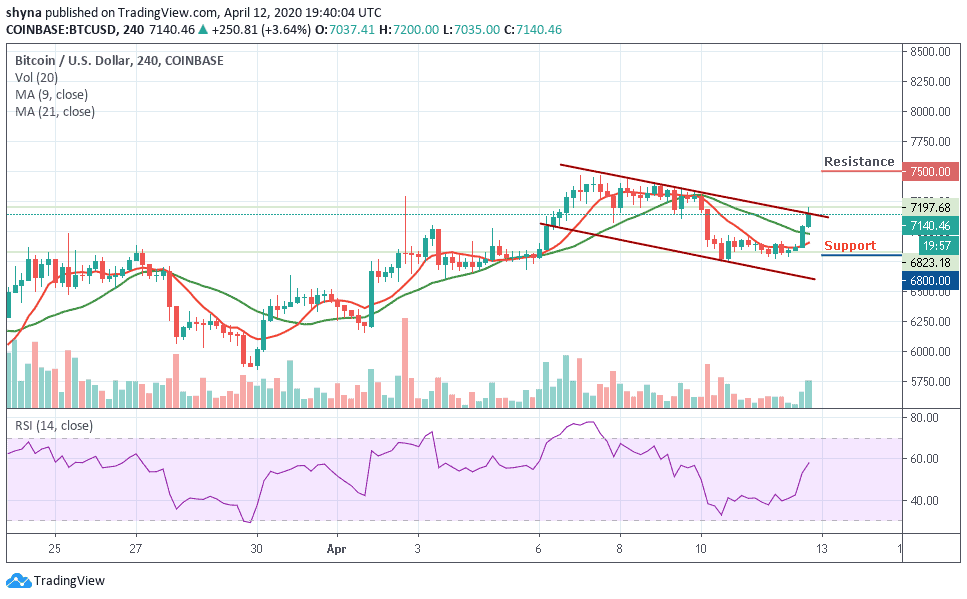
However, if the bulls can reinforce and power the market, traders may expect a retest at $7,300 resistance level and breaking this level may further push the price towards the resistance level of $7,500 and above. The RSI (14) is now moving towards the 60-level, suggesting a bullish movement.
Join Our Telegram channel to stay up to date on breaking news coverage