
Join Our Telegram channel to stay up to date on breaking news coverage
ETH Price Prediction – October 26
Yesterday, the cryptocurrency increased by over 11.92% before the recent price fall but today, the Ethereum price saw a deep decline of around -1.11%.
ETH/USD Market
Key Levels:
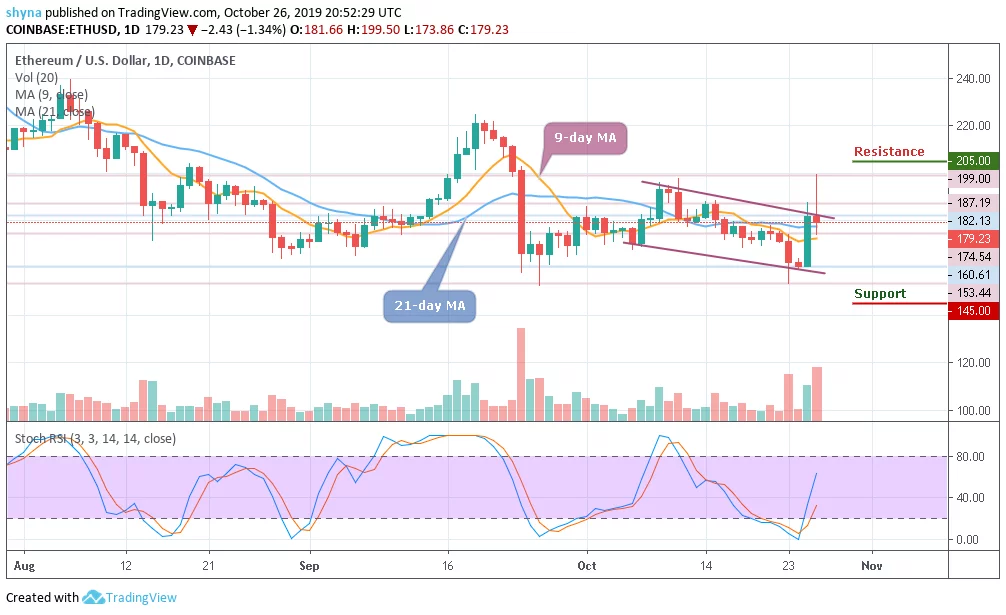
Resistance levels: $205, $210, $215
Support levels: $145, $140, $135
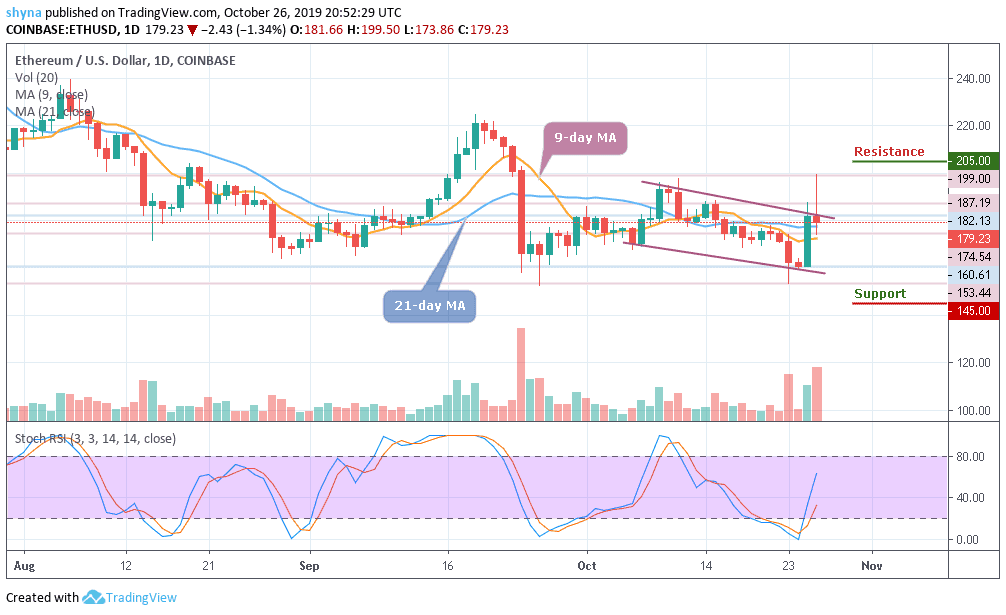
Ethereum (ETH) price has been consolidating within the descending channel for the past few days. For now, ETH/USD is currently trading at $179.23 around the 9-day and 21-day MA at the time of writing. At the opening of the market today, the daily chart shows that the price first went up to $199.00, where it met resistance and then fall to $174.54 support level.
However, ETH/USD buyers have retained control of the market in the early hours of today. Yesterday’s trading has been a resounding victory for the bulls as Ethereum’s price jumped up from $160.61 to $182.13, breaking above the moving averages in the process. The daily breakdown shows us that ETH/USD was following a downtrend before it spiked up to $182.13.
In other words, for a backward movement, the market can be supported at $145 and $140 levels, if the price falls below the previous levels; another support is around $135. But should in case the price exceeds the indicated level by breaking above the channel, the resistance levels of $205, $210 and $215 may be visited. The stochastic RSI is facing the north, which may likely give support to the bulls.
Comparing with Bitcoin, the daily chart shows that ETH/BTC has continued to release the bearish signals into the market as the price move below the 9-day and 21-day moving averages. Today, the price started falling again and broke below the descending channel. Meanwhile, it was shown on the stochastic RSI that the signal lines are found around the oversold territory, which may likely give more bearish signals before a reversal.
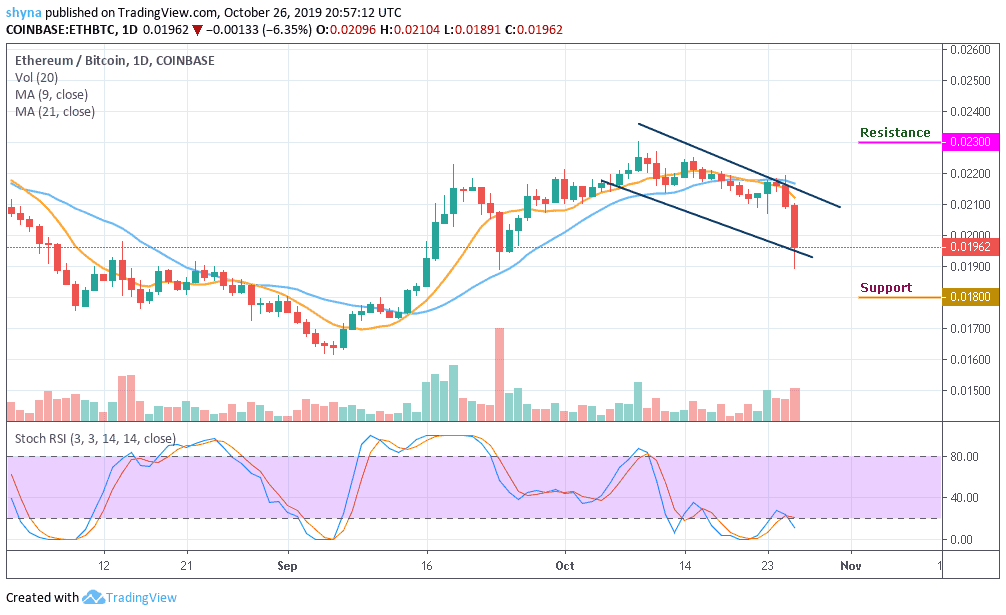
Moreover, the market may continue to decline if the sellers put more pressure on the buyers, the price could come down to the support levels of 0.018 BTC, 0.016 BTC, and 0.014 BTC. Therefore, if a reversal comes up, Ethereum price may likely go up as high as 0.023 BTC, 0.025 BTC, and 0.027 BTC.
Please note: Insidebitcoins.com is not a financial advisor. Do your research before investing your funds in any financial asset or presented product or event. We are not responsible for your investing results.
Join Our Telegram channel to stay up to date on breaking news coverage