
Join Our Telegram channel to stay up to date on breaking news coverage
Bitcoin (BTC) Price Prediction – October 25
This week, the price of bitcoin was divided by a bearish flag, setting a new low around $7,300, and after some consolidation, it has risen again.
BTC/USD Long-term Trend: Ranging (Daily Chart)
Key levels:
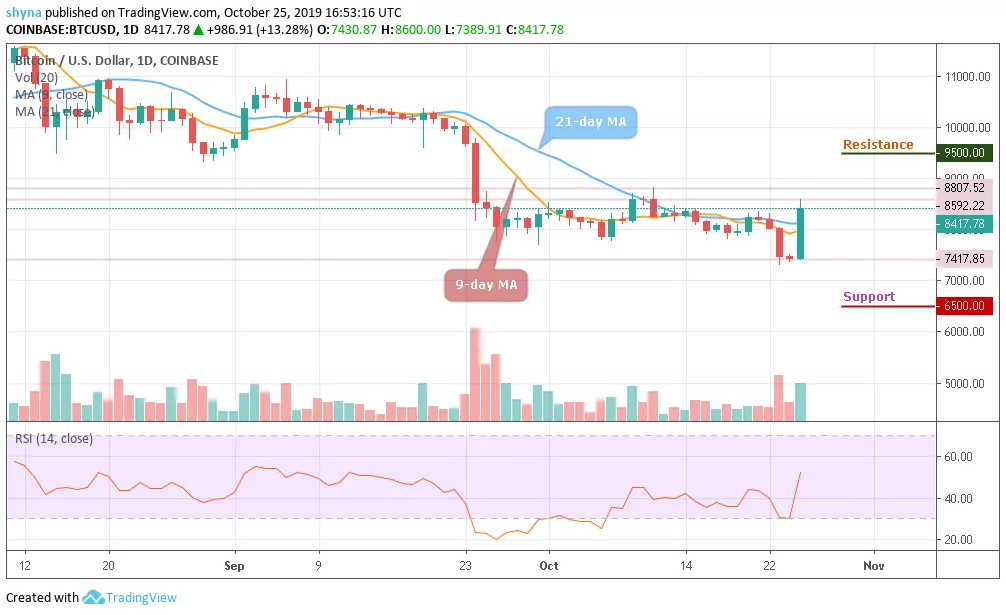
Resistance Levels: $9,500, $10,000, $10,500
Support Levels: $6,500, $6,000, $5,500
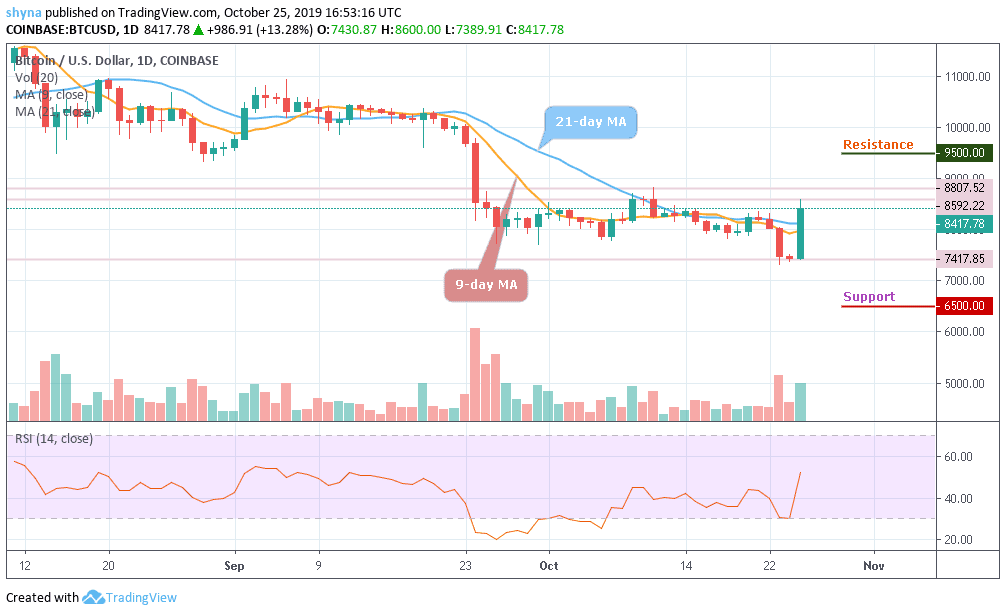
After the breaking down of Bitcoin price from a multi-month descending channel, bears completely took control of the number one crypto asset, and were able to swat the price of the cryptocurrency down to as low as $7,400 this week. Sentiment hit extreme lows, with the entire crypto community left in fear that the bear market wasn’t over, and a bottom may not be in.
But today, the early signs of a reversal are forming, with a nearly $1,000 green candle striking fear into the hearts of overly confident bears and push the Bitcoin price above $8,400. The bullish push is still underway, and currently trading at $8,417 around 9 and 21 days MA; to the shock and dismay of bears who had shorted Bitcoin from above. With such a powerful display from the buyers, there’s potential that the move could spark a larger reversal in the bearish trend that was starting to take hold.
Meanwhile, as the RSI (14) move towards level 60, the $8,800 and $9,000 levels may further surface as critical resistances if the $8,500 holds. However, a strong bullish spike might take the price to $9,500, $10,000 and $10,500 resistance levels. If the market decides to go down, Bitcoin’s price may drop to $8,000 or resell to today’s buy-back support at $7,400. Should this support fail to contain sell-off; we may see a further roll back to $6,500, $6,000 and potentially $5,500.
BTC/USD Medium-Term Trend: Bullish (4H Chart)
Looking at the 4-hour chart, Bitcoin’s price is currently trading around $8,724 and above the 9-day and 21-day moving averages after a reversal from $7,413 where the market started trading today. Meanwhile, we can see that the bullish supply is becoming heavy in the market while the bears are also trying to drag the price down.
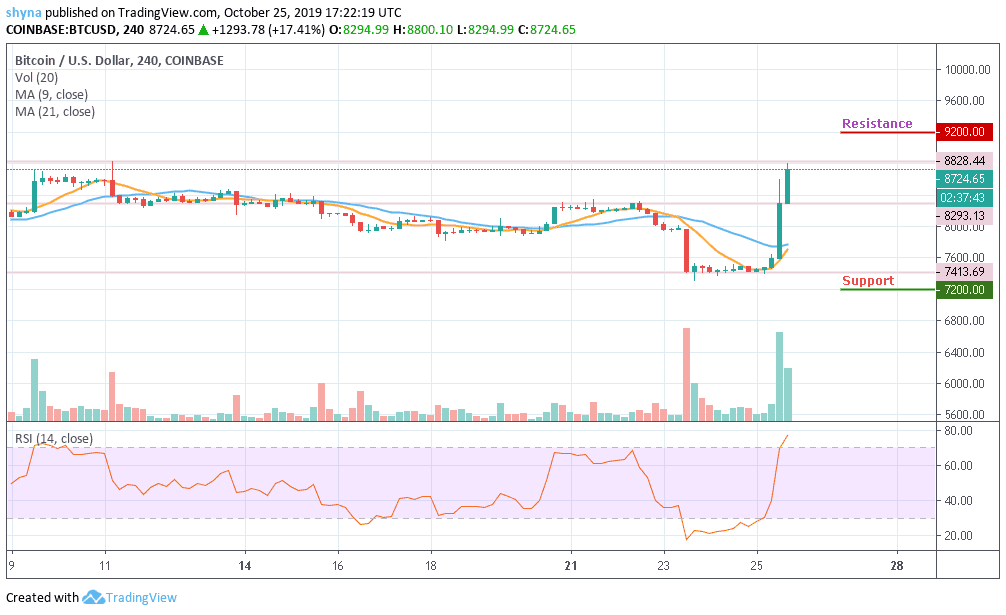
In addition, if the buyers can strengthen and energize the market, they can further push the price to a $9,000 resistance level. Therefore, breaking the mentioned resistance could also allow the bulls to test the $9,200 and above. Inversely, the RSI (14) is currently in the overbought zone, but when it turns down, the bears may step back to drag the price to the support level of $7,200 and below.
Please note: Insidebitcoins.com is not a financial advisor. Do your research before investing your funds in any financial asset or presented product or event. We are not responsible for your investing results.
Join Our Telegram channel to stay up to date on breaking news coverage