Join Our Telegram channel to stay up to date on breaking news coverage
ETH Price Prediction – November 6
Ethereum (ETH) breaks above $190 and a stronger retest of previous resistance is expected. The coin remains in the buy phase despite the recent price fall.
ETH/USD Market
Key Levels:
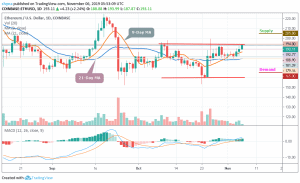
Resistance levels: $205, $210, $215
Support levels: $165, $160, $155

Ethereum bulls are intentional about finding higher support for the coin. This battle comes after ETH/USD tried and failed to extend gains past $194 which happens to be the daily high as at the time of writing. Ethereum price is back under $195 and currently exchanging hands at $193.11. Moreover, ETH/USD is moving above the 9-Day Moving Average and the 21-Day Moving Average.
Furthermore, as long as the 9-MA remains above the 21-MA, traders can expect ETH to consolidate at higher levels. That’s if we could see a further climb above the $195 which is fast approaching; it may likely reach the supplies at $205, $210 and $215. Meanwhile, the critical demand levels to watch for lie at $165, $160 and $155 respectively.
Currently, the Ethereum price follows a dominant bullish bias. A glance at the Moving Average Convergence Divergence (MACD) displays a positive picture for the coin in the near-term. In addition, by maintaining a gradual upward slope in the positive region, the MACD divergence is becoming a sign of growth in the buying entries.
When compared with Bitcoin, the daily chart reveals that the bulls are making effort to step back into the market and the coin is making an attempt to show some promising signs that could make higher highs if the price moves above the 9-day and 21-day moving averages. On the upside, the nearest level of supply lies at 0.021 BTC and above this, higher resistance lies at 0.0215 BTC and 0.022 BTC.
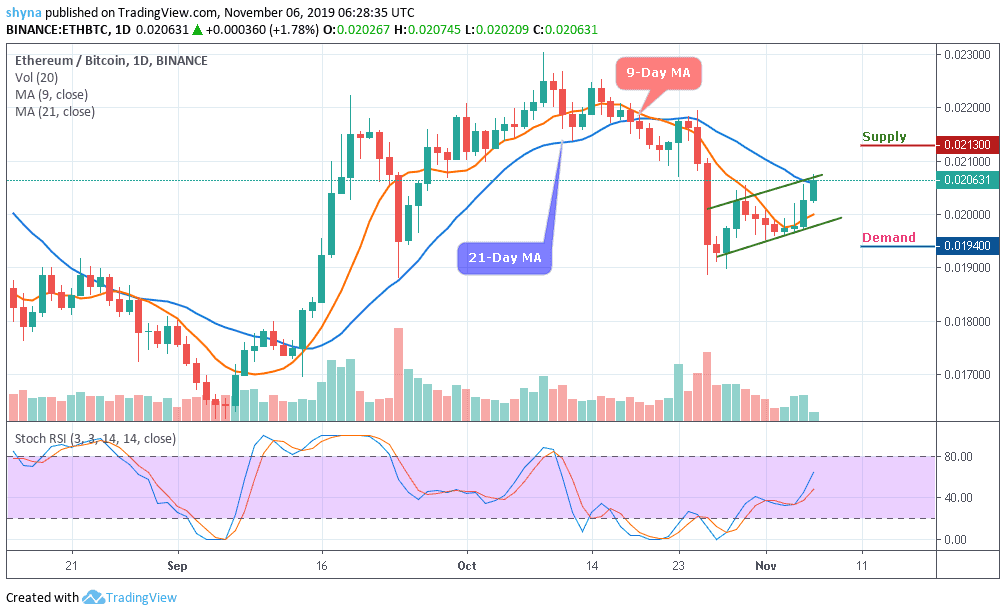
Moreover, when looking from the downside, the nearest levels of demand are 0.0201 BTC and beneath this, further demand lies at 0.0197 BTC. If the price drops further to create another low, lower demand is located at 0.0194 BTC, 0.0190 BTC, and 0.0185 BTC. The stochastic RSI is making an attempt to break above the 60-level which indicates that the bulls may come into play.
Please note: Insidebitcoins.com is not a financial advisor. Do your research before investing your funds in any financial asset or presented product or event. We are not responsible for your investing results.
Join Our Telegram channel to stay up to date on breaking news coverage