Join Our Telegram channel to stay up to date on breaking news coverage
Ethereum (ETH) Price Prediction – March 14
ETH/USD pair was previously in a bull market as it reached a high of $286. The bulls have initially tested the high of $286 but in a bit to break the overhead resistance, the three tops were formed. Eventually, Ether fell and was on the downward move. Similarly, in ETH/BTC, the pair was in an uptrend but after testing the overhead resistance at Ƀ0.028000, it was resisted.
ETH/USD Market
Key Levels:
Resistance Levels: $200, $220, $240
Support Levels: $160, $140, $120
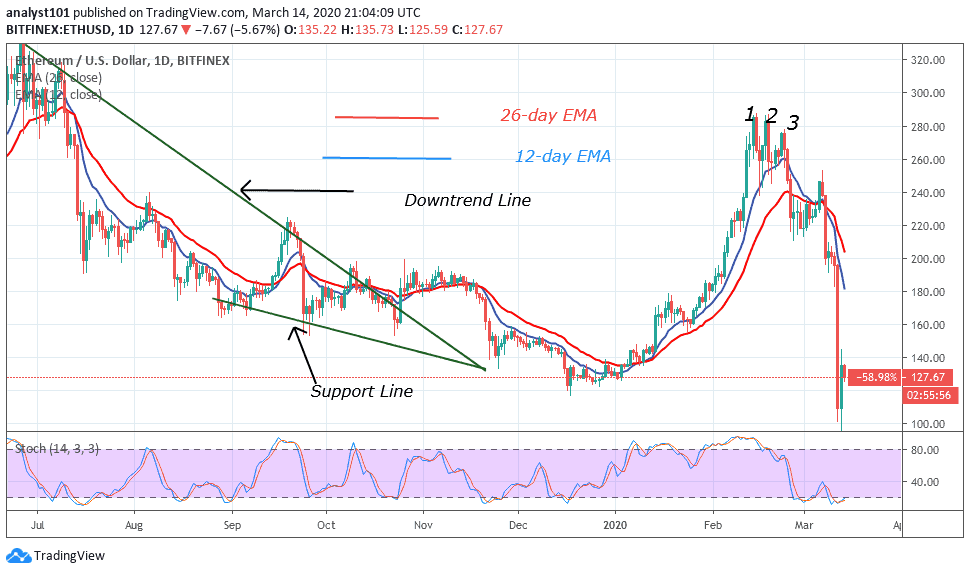
Presently, Ethereum has been a downward move after the overhead resistance. The downward move was propelled by a bearish triple top pattern. The bearish triple top pattern reverses the previous trend. The downward move was in three phases as ETH plunges to its low. The first bearish impulse reaches a low of $220. The price consolidated above $220 and retested the $245 price level.
In the second phase, ETH dropped to a low of $200. Thirdly, after consolidation above $200, Ether finally dropped to the low of $101. At the moment, the market has moved above $120 price level. Ethereum upward move is possible if the bulls defend the current support and the price is sustained. Ethereum is below 20% range of the daily stochastic. In other words, Ether is in the oversold region of the market. This indicates that buyers are likely to emerge in the oversold region

Similarly, in the ETH/BTC pair, the uptrend reached a high of Ƀ0.028000. The bulls could not penetrate the resistance. However, after three unsuccessful attempts at Ƀ0.028000, the bulls were resisted. The pair dropped to the low of Ƀ0.021000 but pulled back above Ƀ0.022000. The pair will continue its upward move if the current support holds. Meanwhile, the Relative Strength index period 44 indicates that the coin is in the downtrend zone and below the centerline.
Please note: Insidebitcoins.com is not a financial advisor. Do your research before investing your funds in any financial asset or presented product or event. We are not responsible for your investing results.
Join Our Telegram channel to stay up to date on breaking news coverage