Join Our Telegram channel to stay up to date on breaking news coverage
ETH Price Prediction – December 17
Ethereum (ETH) is diving below the key supports against the USD and BTC. It may continue to move down towards $115 if it fails to stay above $120.
ETH/USD Market
Key Levels:
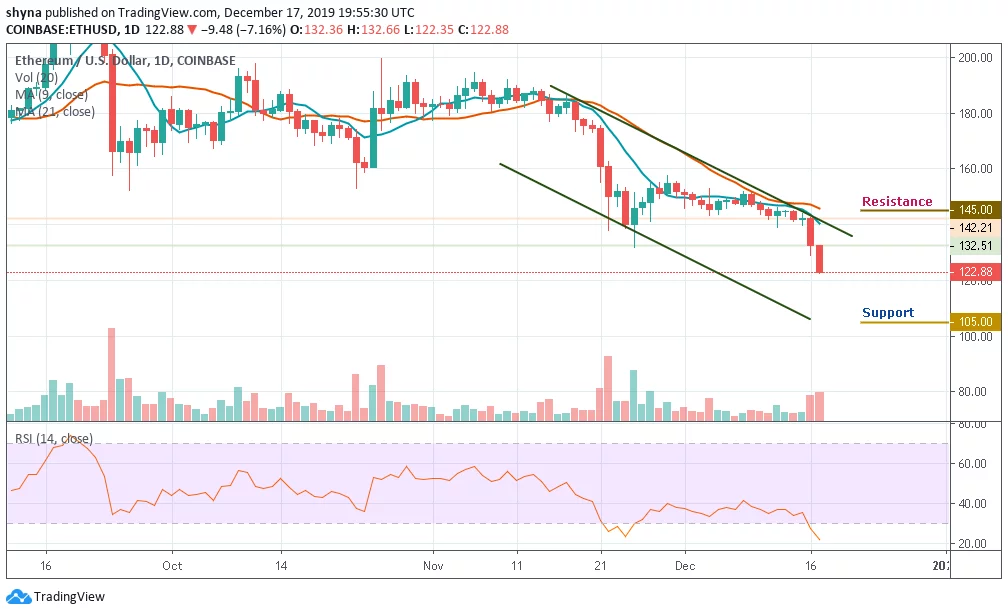
Resistance levels: $145, $150, $160
Support levels: $105, $100, $095
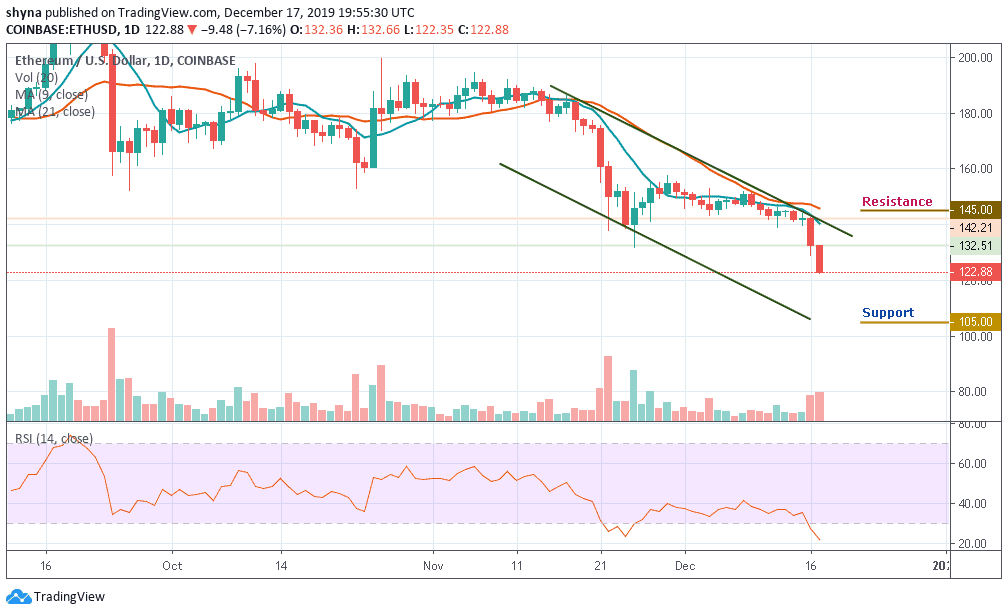
As the market opens today, ETH/USD has been dropping with a bearish bias. The coin opened at $132.51 and currently dropped below $125 support level. Ethereum price did start a nasty declining and broke many supports near $120. The price could correct higher, but it is likely to face sellers near $126 or $128.
On the downside, there is a close below the $120 level as the coin moves under the 9-day and 21-day moving averages. As a matter of fact, dropping further could open the doors for more losses and the price may tumble below the $115 level. More so, should it spike below the $115 support, the critical support levels of $105, $100 and $95 may be tested as the RSI (14) indicator nosedived into the oversold zone.
Moreover, ETH/USD could either recover above $130 or extend its decline. On the upside, the next major resistance is near the $140 level. Having said that, the price must climb above the $145, $150 and $160 resistance levels to move back into a positive zone. If not, there is a risk of more downsides below the $120 support level.
When compared with Bitcoin, the market price remained in the descending channel and the bears are still dominating the market. ETH/BTC is currently trading at 0.018 BTC and the bulls couldn’t push the price to the north. Looking at the chart, if the market continues to drop, the next key supports may likely be at 0.0170 BTC and below.
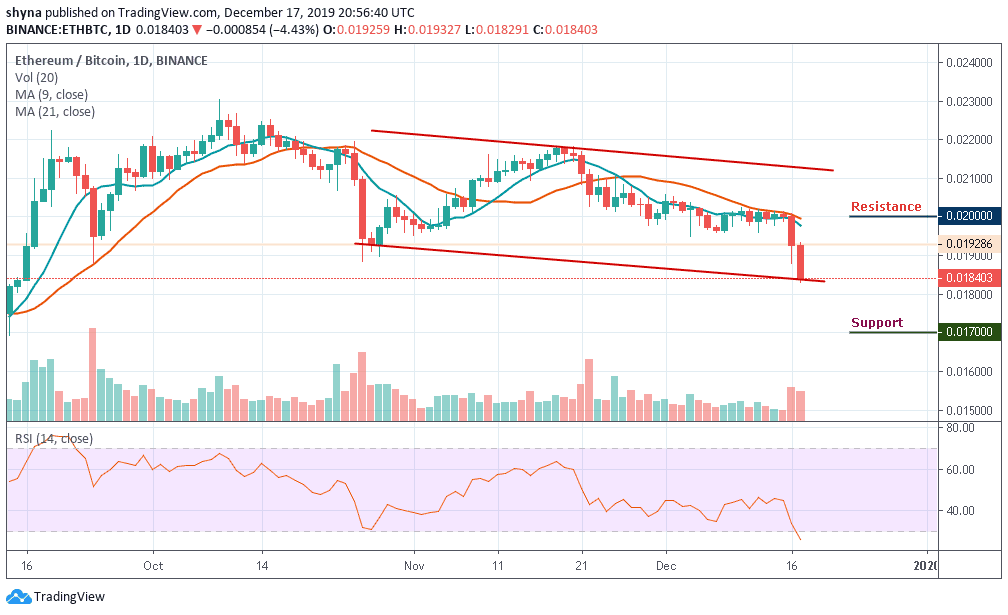
In other words, a possible bullish movement could push the market towards the moving averages of 9-day and 21-day within the channel, a break above this will enable ETH to reach a high of 0.020 BTC and above but the RSI (14) has entered into the oversold territory which indicates that the market may continue to fall.
Please note: Insidebitcoins.com is not a financial advisor. Do your research before investing your funds in any financial asset or presented product or event. We are not responsible for your investing results.
Join Our Telegram channel to stay up to date on breaking news coverage