Join Our Telegram channel to stay up to date on breaking news coverage
ETH Price Prediction – August 6
ETH/USD bulls couldn’t climb above $400 mark as the second largest coin touched the daily low at $392.
ETH/USD Market
Key Levels:
Resistance levels: $450, $470, $490
Support levels: $340, $320, $300
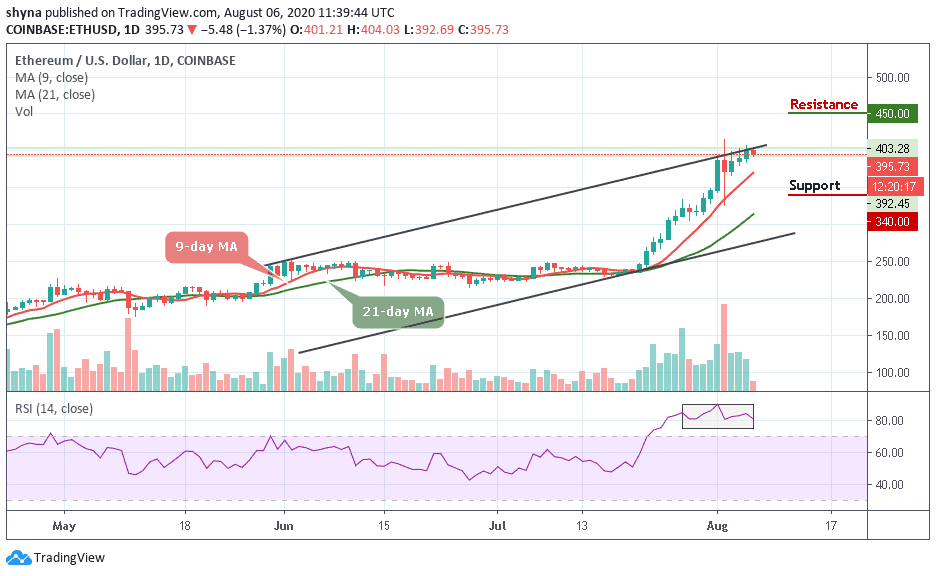
According to the daily chart, ETH/USD is hovering at $395.73 so it may take a few more days for it to catch up above the $400 resistance level. However, the Ethereum has not seen any major pullbacks yet and may use the 9-day MA for support if it happens. More so, the most important signal for Ethereum is the break of $420, which represented a major resistance level. If the bulls can stay above this level, they may absolutely confirm a monthly uptrend.
Will ETH Break Through Resistance Level of $400 or Reverse?
The Ethereum pair may succumb to selling pressure if the price drops below the 9-day moving average at $365 support. Meanwhile, the price of Ethereum hasn’t changed much during the past few days despite the massive flash crash down to $330 suffered on August 2. The digital asset is currently fighting to stay above $400 but might not face a lot of resistance until it gets to $450 level.
Moreover, the technical indicator RSI (14) is seen moving within the overbought region, if the signal line drops below 80-level, the market price may likely resume the downtrend to hit the supports at $340, $320, and $300, but if it breaks above the 90-level upward, the potential resistance at $450, $470, and $490 may be visited.
Against the BTC, the price of Ethereum is clearly bearish. As the price falls, sellers are posing an additional threat for buyers which may likely reach the 0.032 BTC where the nearest target is located. However, an eventual break below the 9-day and 21-day moving averages may cause the coin to collapse.
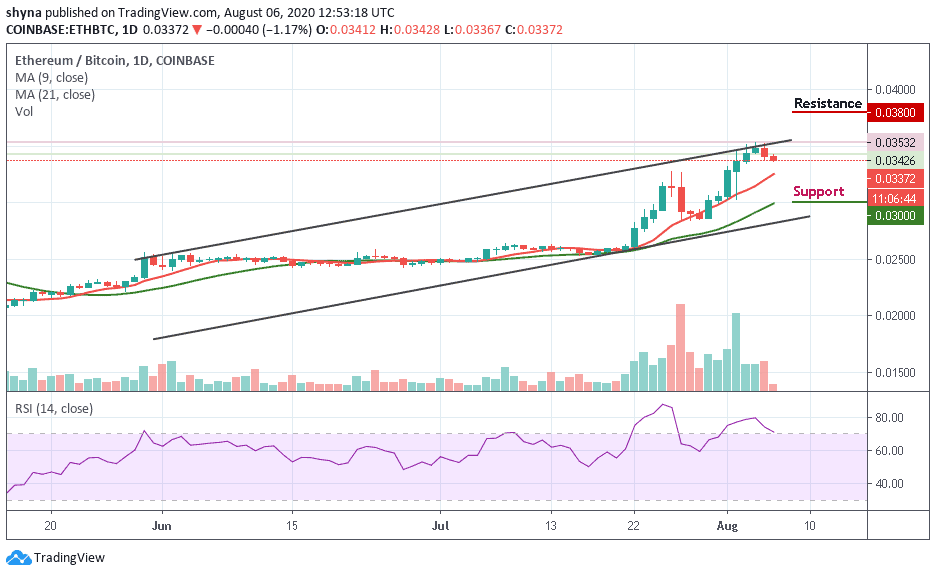
Moreover, a continuation of the downtrend could hit the main support at 0.031 BTC before falling to 0.030 BTC and below as the RSI (14) is seen moving out of the overbought zone. However, if the price breaks above the channel, the buyers may resume back and push the market to the potential resistance at 0.038 BTC and above. Nevertheless, ETH will continue to fall if the sellers continue to release the pressure.
Join Our Telegram channel to stay up to date on breaking news coverage