


Join Our Telegram channel to stay up to date on breaking news coverage
ETH Price Prediction – July 2
Ethereum (ETH) is down with a 1.8% price decline over the past 24 hours of trading as the cryptocurrency rolls over and drops beneath $230.
ETH/USD Market
Key Levels:
Resistance levels: $245, $247, $249
Support levels: $205, $203, $201
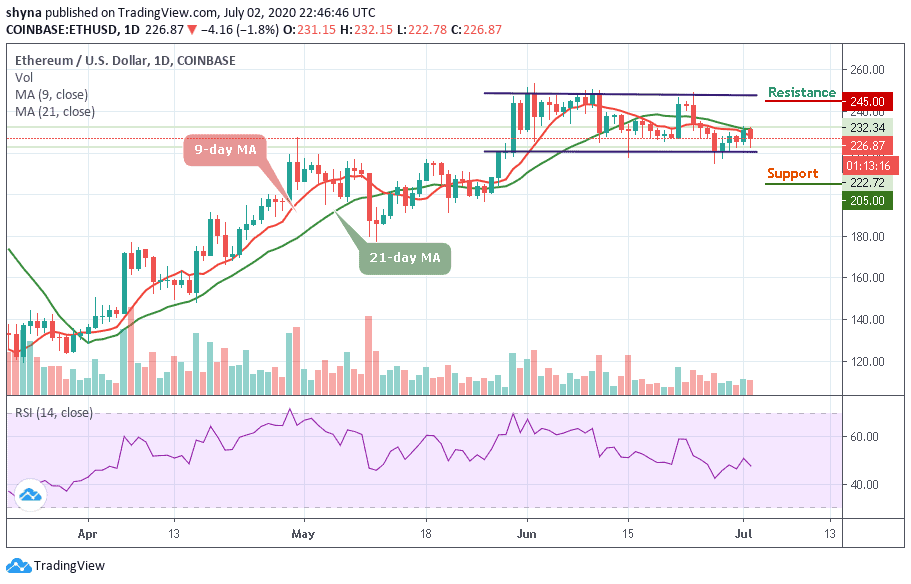
Since the beginning of this month, ETH/USD has not been able to climb much higher from the $233 level as the market started to roll over and fall within the channel. ETH/USD remains below the 9-day and 21-day moving averages but it can rise higher and break above the last month’s high at around $253 if the bulls put more effort.
However, if the sellers continue to add downward pressure to the coin, initial support is expected at $205. Beneath this, support can be found at $203, and $201. On the other hand, if the bulls can defend the $226 level and allow ETH to rebound, an initial resistance is located above the moving averages at $235. Above this, additional resistance is expected at $245, $247, and $249.
Meanwhile, the technical indicator RSI (14) is seen falling below 50-level which shows that the previous bullish momentum is starting to fade. If the technical indicator manages to remain above the 50-level then the bulls stand a chance to allow Ethereum to rebound at $226. However, if it penetrates beneath, the cryptocurrency may continue a downward spiral.
Against Bitcoin, the daily chart reveals that the bears are making effort to step back into the market and the coin is making an attempt to show some negative signs that could make higher lows if the price moves below the 9-day and 21-day moving averages. On the downside, the nearest level of support lies at 0.0240 BTC and below this, critical support lies at 0.0237 BTC.

Moreover, when looking from the upside, the nearest resistance level is 0.0250 BTC and above this, further resistance lies at 0.0260 BTC and above. The technical indicator stochastic RSI is moving above the 30-level which indicates that bullish signals may come into play.
Read more:
- Bitcoin Price Prediction: BTC/USD Price Holds $8,500 Support as the Bears Eye $7,500
- Litecoin Price Prediction: LTC/USD Witnesses a Line of Price Convergence Around $240
Join Our Telegram channel to stay up to date on breaking news coverage
