Join Our Telegram channel to stay up to date on breaking news coverage
ETH Price Prediction – July 17
ETH/USD is approaching a crucial support level and the coin must hold the $235 support to climb towards $250.
ETH/USD Market
Key Levels:
Resistance levels: $260, $265, $270
Support levels: $220, $215, $210
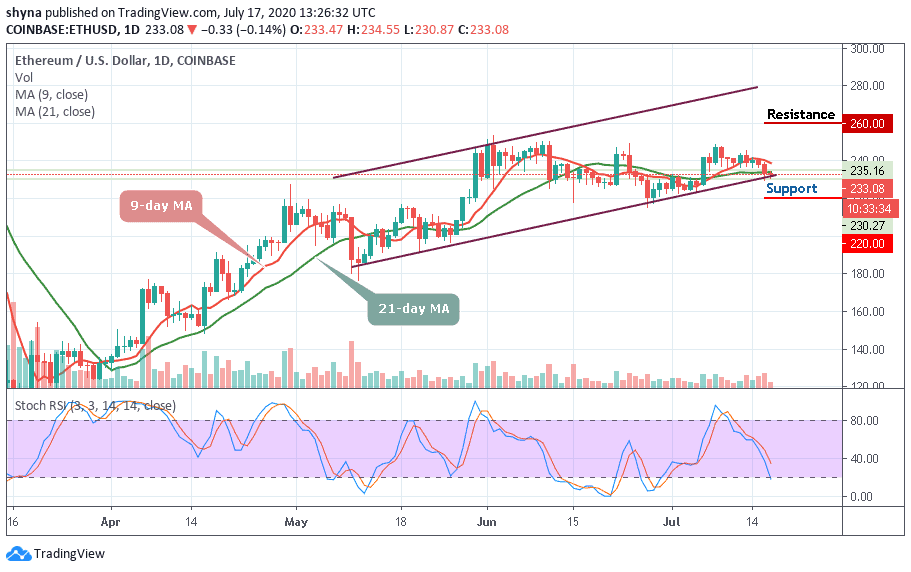
ETH/USD is trading down 0.14% at its current price of $233.08, which marks a notable decline from its daily high of $235 that was set today when the bulls attempted to spark another rally. In the near-term, ETH/USD has been able to find some support in the lower $230 level, as it has bounced multiple times after visiting this level.
However, the price of the Ethereum has been bitten by the bears several times. ETH/USD may continue to experience a price drop as many traders were expecting a lot from the coin. Meanwhile, the price is currently moving under the 9-day and above the 21-day moving averages which are yet to break out to the upside or downside of the channel.
However, a bearish drop may likely roll the market down to the support level of $220, $215, and $210 as the stochastic RSI focuses on the south while possible bullish surge above the moving averages may drive the market to $250 level, further positive movement may hit the potential resistance at $305, $310 and $315 levels. The RSI (14) moves above 60-level and staying there could cause the coin to remain above the $258 support level.
Watching it against Bitcoin, the price action appears to be in a downtrend, following the recent low break scenario owing to Bitcoin’s fall. Few of the top 20 coins suffered a double-drop than the leading global currency. Currently, ETH price is trading at 2546 SAT price level.
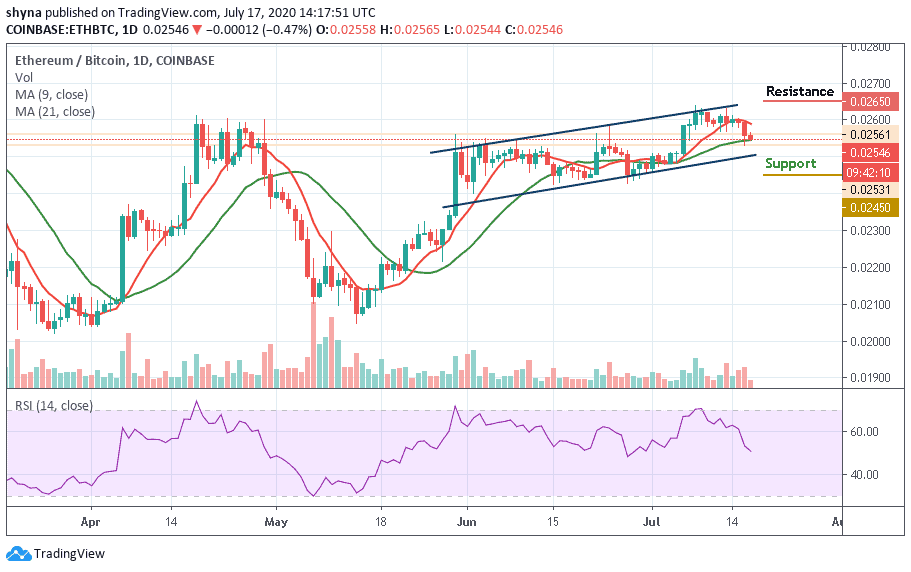
Nevertheless, ETH/BTC has been trending around the 21-day MA and it may likely break below the channel to touch the support of $2450 and below. Meanwhile, a retracement could hit 2531 SAT, re-testing yesterday’s lower. Still, the major resistance level is 2650 SAT and above. The technical indicator RSI (14) is already touching 50-level which is a sign of selling pressure
Join Our Telegram channel to stay up to date on breaking news coverage