Join Our Telegram channel to stay up to date on breaking news coverage
ETH Price Prediction – December 19
A few days ago, Ethereum bears put intense pressure on support areas as focus shifts to $125.
ETH/USD Market
Key Levels:
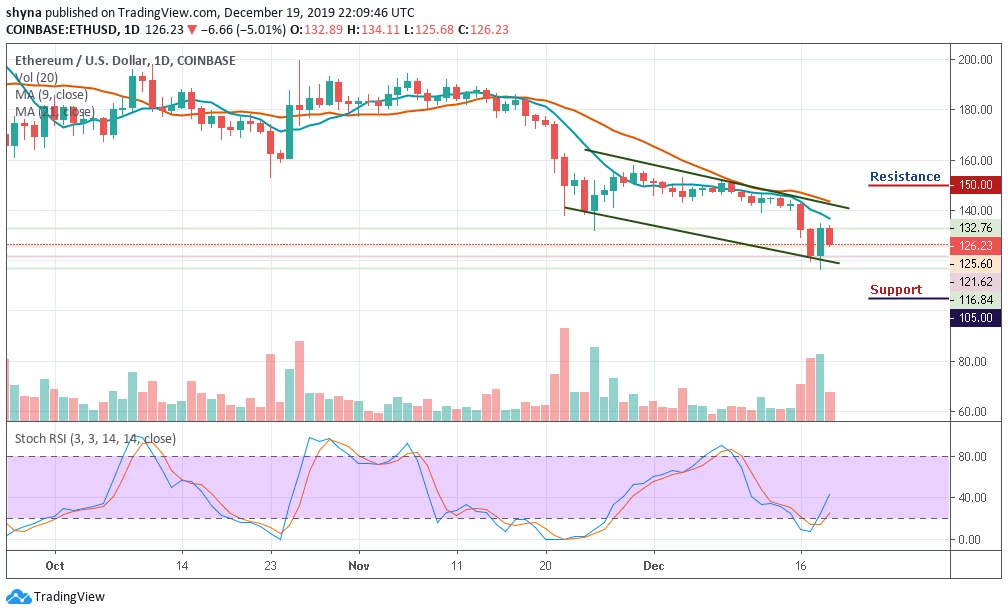
Resistance levels: $150, $160, $170
Support levels: $105, $100, $095
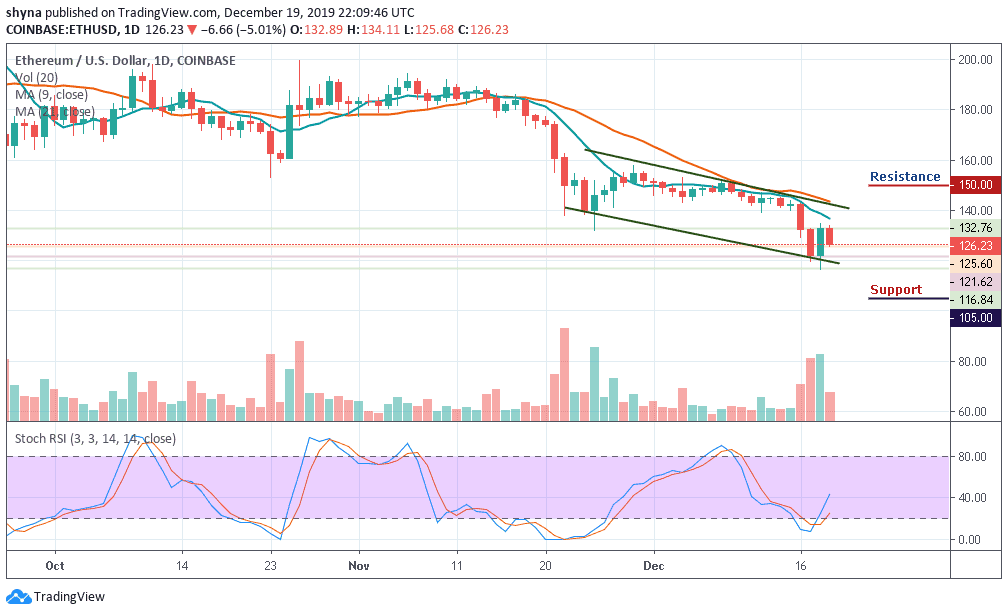
Yesterday was an overwhelmingly bullish day for the cryptocurrency markets, which led Ethereum (ETH) and most other major altcoins to climb as much as 10%. At the time of writing, ETH/USD is trading down marginally at its current price of $126.23, which marks a notable decline from its daily highs of $133.96 which has been set at the peak of the recent upswing in the aggregate crypto markets.
Moreover, ETH/USD keeps trending in a downward channel formation, trading below the moving averages of 9 and 21 days. Yesterday, as the market opened, ETH/USD fell from $121.62 to $116.84 but later rose and closed at $132.76. Today, after the opening of the market, the daily price chart shows that after ETH/USD touched $133.96, the coin started falling from $132.76 to $126.23, where it is currently trading.
However, as ETH/USD follows the downward trend, the market can later be supported at $105 and $100 levels, if the price falls below the previous levels; another support is around $95. But should in case the price exceeds the $132.76 level by moving upward, then, the resistance levels of $150, $1600 and $170 may be visited. The stochastic RSI is moving out of the oversold zone, which may likely inject some bullish signals into the market.
By comparing with Bitcoin, the daily chart reveals that ETH/BTC trading below the 9-day and 21-day MA keeps on releasing more bearish signals into the market. Today, the price started falling again and it was shown on the Stochastic RSI as the signal lines are found at the oversold territory, which might be considered as more bearish signs for the market until a rebound occurs.
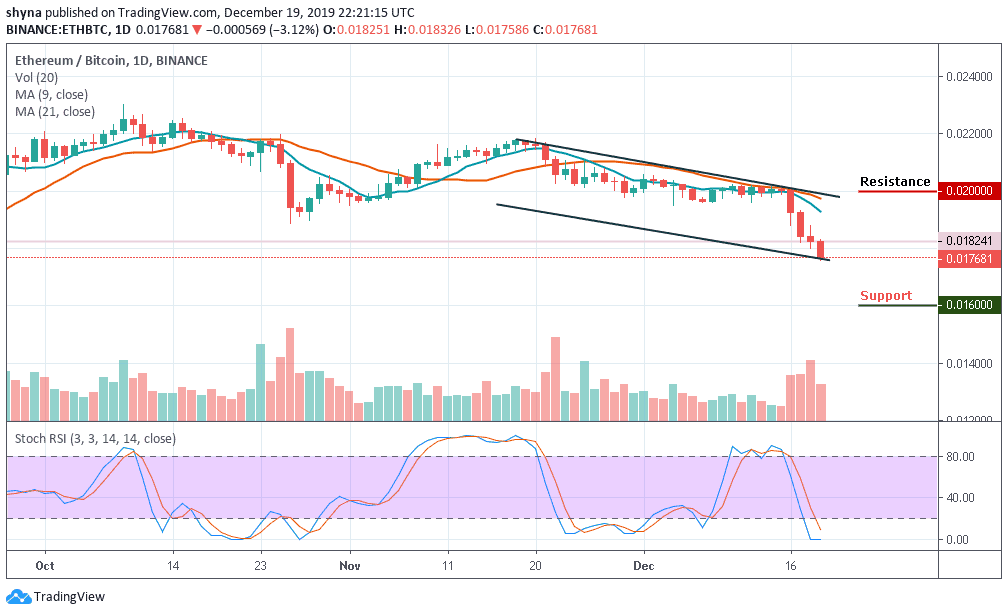
Moreover, the market may continue to decline if the sellers put more pressure on the buyers, the price could come down to the support levels of 0.016 BTC, 0.015 BTC, and 0.014 BTC. Therefore, if there is a rebound, Ethereum price may likely go up as high as 0.020 BTC, 0.021 BTC, and 0.022 BTC.
Please note: Insidebitcoins.com is not a financial advisor. Do your research before investing your funds in any financial asset or presented product or event. We are not responsible for your investing results.
Join Our Telegram channel to stay up to date on breaking news coverage