Join Our Telegram channel to stay up to date on breaking news coverage
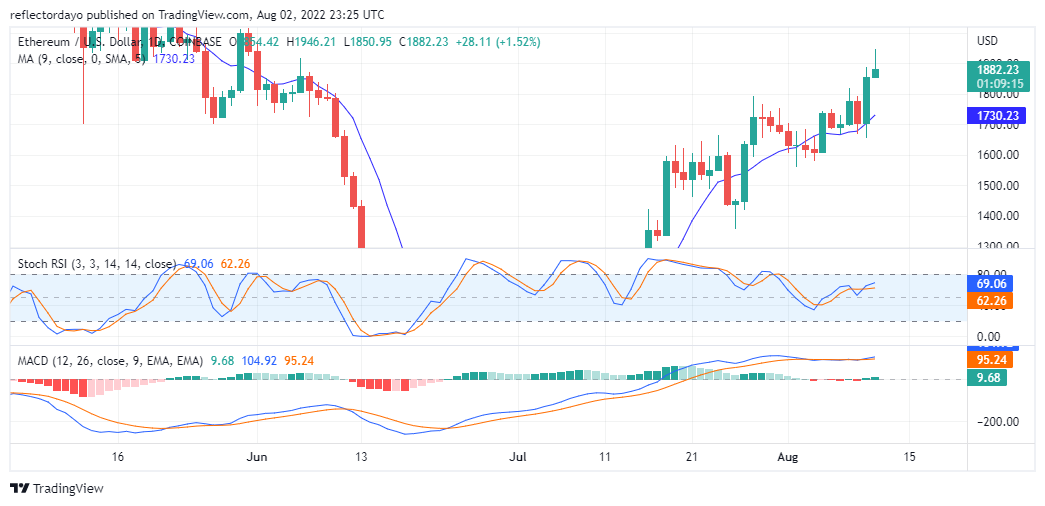
ETH/USD price chart shows that price action has broken the $1800 resistance, and now testing the $1900 resistance level.
Ethereum Prediction Statistic Data
Ethereum Price Now – $1895
Ethereum Market Cap – $229 Billion
Ethereum circulating supply 121.9 million
Ethereum total supply – 121.9 million
Ethereum current rating – #2
ETH/USD Market
Resistance level: $1753, $1800 $1900
Support level: $1846, $1711, $1600
Ethereum Price Forecast: What the Indicators are Saying About ETH/USD
At the present, ETH/USD is valued at $1895 with a bullish market momentum. The Relative Strength index indicates a strong bullish trend at 69%. In support of this indication, the 9-day moving average curve is below the price activities. This shows that the bulls are in control of the market for now. According to the MACD, the signal lone could not cross the MACD line although it came close to crossing it. If it had crossed it, it could have signal a change in the trend which will be favouring the bears. Instead the MACD line recovered its upward momentum. Going by the trend, it is possible that the coin will find a new resistance at $1950.
Ethereum Price Forecast: ETH/USD 4-Hours Chart Outlook
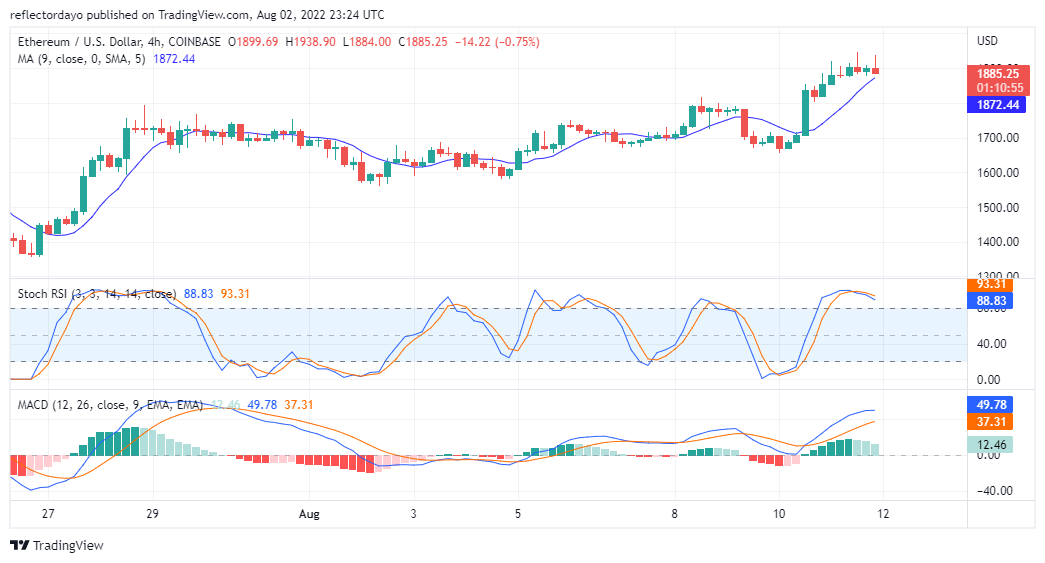
In contrary to the daily chart, Ethereum uptrend is weakening we see that the RSI signals that price have entered the overbought region. Also, the signal line has crossed the RSI curve and the curve is coming down as expected, although its activity of the indicator is at 89%.
Ethereum Price Forecast: ETH/BTC on The Upside Movement
ETHBTC is also enjoying bullish market momentum. The 21-day moving average and the 9-day moving average are well below the market action. And other indicators are in support of an uptrend. The RSI is measuring strength of 77%. And the 9-day moving average is at $0.074166 which is below the price of the market and the price of the market is $0.074166.
Related
Join Our Telegram channel to stay up to date on breaking news coverage


