Join Our Telegram channel to stay up to date on breaking news coverage
ETH Price Prediction – March 21
Despite the short-term peak above $1800, Ethereum is showing lower trading signals in the coming days.
ETH/USD Market
Key Levels:
Resistance levels: $2000, $2100, $2200
Support levels: $1500, $1400, $1300
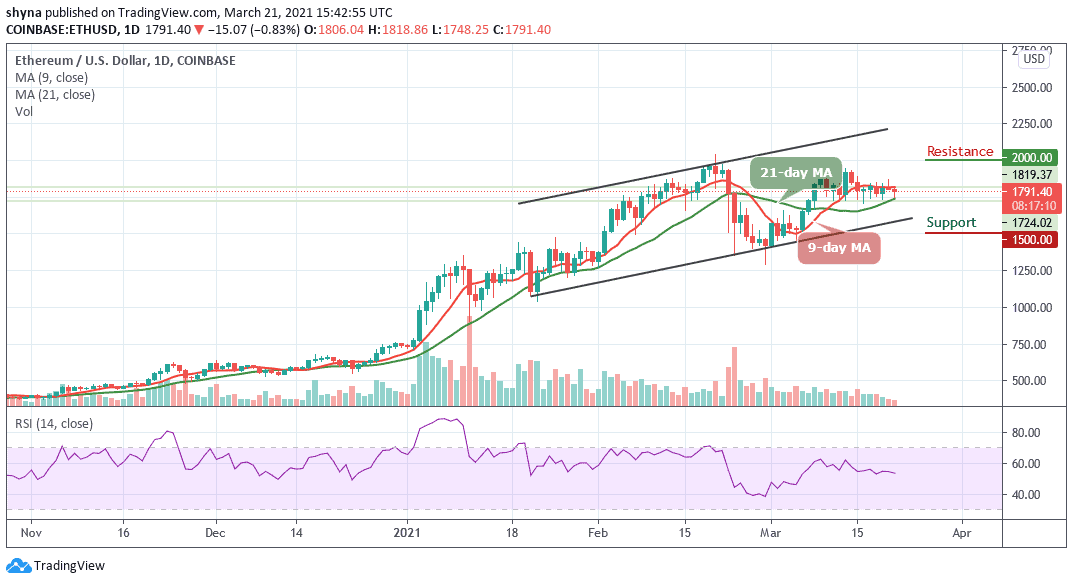
ETH/USD is currently declining and it may likely trade below the 21-day moving average as the coin is holding the $1700 support level, but there is a possibility of sideways movement in the near term. However, the pair is currently consolidating within the moving averages and it could decline towards the $1700 support if the technical indicator faces the south. Meanwhile, the Ethereum price is struggling to resume higher as the price might revisit the $1700 support level before it could climb again.
Where is LTC Price Going Next?
If there is an upside break above $1800, the price could test the $1900 resistance level. Any further gains might push the price towards the $2000, $2100, and $2200 resistance levels. On the downside, the $1700 level is initial support and if there are more downsides, the price could test the critical support levels of $1500, $1400, and $1300, where the bulls are likely to take a stand.
Moreover, ETH/USD is yet to show some positive signs above the $1850, but it might dip further in the short term. Having said that, ETH/USD may likely bounce back above $1850, as long as there is no daily close below the $1700. However, the RSI (14) may likely follow the sideways movement as the signal line stays around 53-level.
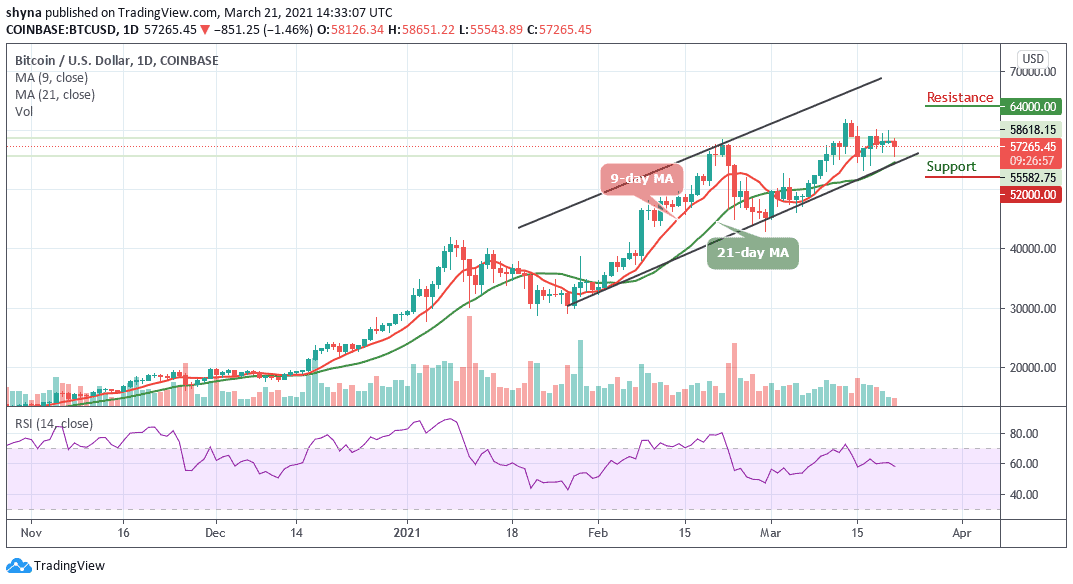
Against Bitcoin, the price behaves differently and the trend is well-maintained and remains within the moving averages. It keeps the support below the 9-day and 21-day moving averages, it may find another support below the lower boundary of the channel at $0.025 BTC and below.
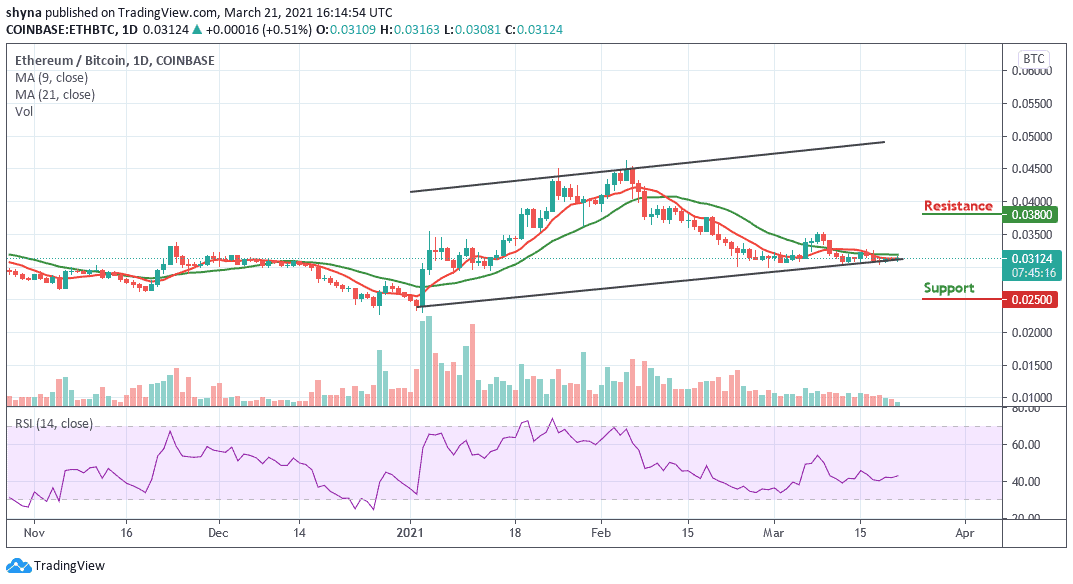
However, the bulls are making effort to bring the price of ETH/BTC above the moving averages and if they are able to do so, the price could hit the resistance levels at 0.038 BTC and above. More so, the RSI (14) indicator is moving in the same direction above 40-level which may likely cause the market to move sideways.
Join Our Telegram channel to stay up to date on breaking news coverage