Join Our Telegram channel to stay up to date on breaking news coverage
ETH Price Prediction – February 18
The Ethereum steady bullish action is breaking above the $1900 barrier; although, eyes currently glued on $2000.
ETH/USD Market
Key Levels:
Resistance levels: $2300, $2400, $2500
Support levels: $1600, $1500, $1400
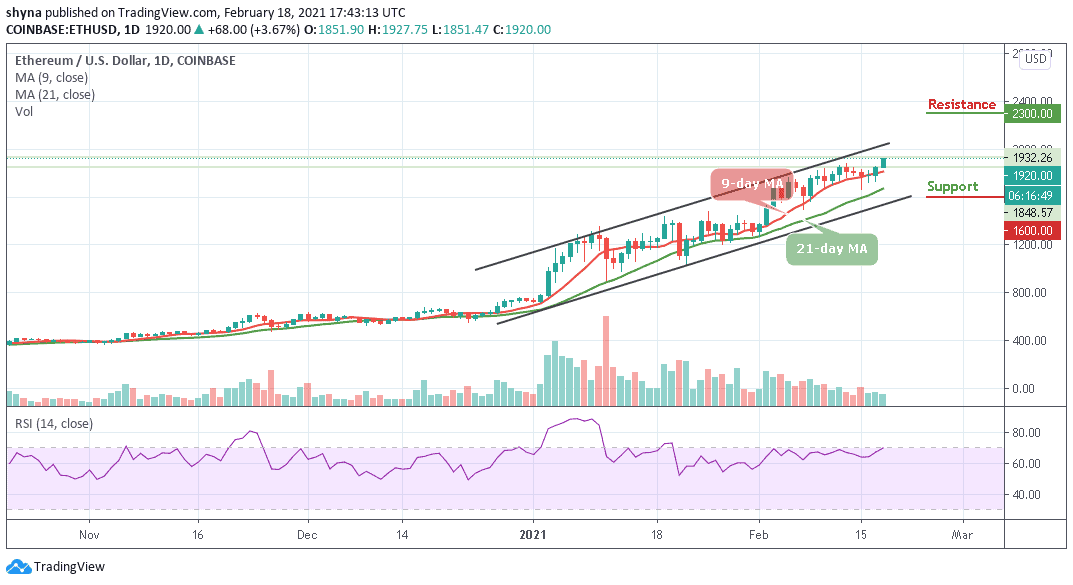
ETH/USD is seen refreshing to a new high after opening today’s market at $1851 to breaches above $1900 while currently trades at $1920 with a bullish crossover and trend in the intraday. At the time of writing, ETH/USD keeps trading above the 9-day and 21-day moving averages. Meanwhile, higher support at $1700 is expected to be a stepping stone for a comeback past $1800 and the majestic rally eyeing a $2000 resistance level.
Where is ETH Price Going Next?
The current technical level suggests that bulls are not yet done because the moment the technical indicator crosses above the 70-level and move into the overbought region, the faster they cross above the upper boundary of the channel to reach the resistance levels of $2300, $2400, and $2500 respectively. For now, traders may conclude that the trend of the market is in the bulls’ hands as the RSI (14) is not only above the 70-level but also moving further towards the overbought region.
However, the daily chart reveals that the narrowing gap between the 9-day MA and the 21-day MA shows that ETH/USD is bullish both for the short term and the long term Meanwhile, for a backward movement, the market can be supported at $1750 and $1700 levels if the price falls below the previous levels; the critical supports are located at $1600, $1500, and $1400 respectively.
When compares with Bitcoin, the price of Ethereum is currently hovering under the 9-day and 21-day moving averages. Meanwhile, looking at the daily chart, the coin is making an attempt to cross above the moving averages. However, if the bulls decide to power the market, traders may find the resistance level at 4400 SAT and above.
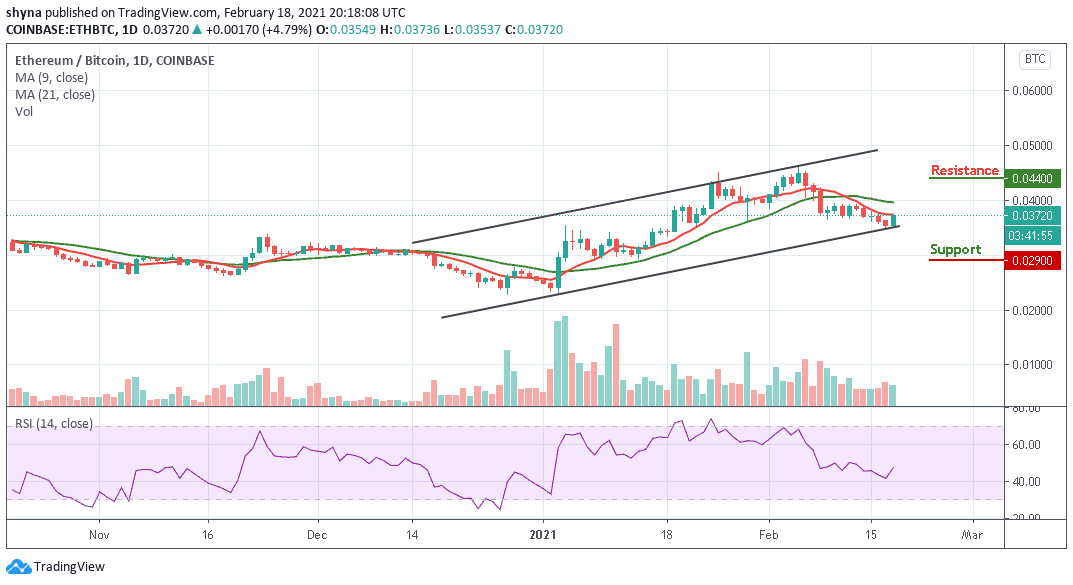
On the contrary, if the price breaks below the lower boundary of the channel, it could lead to the critical support level of 2900 SAT and below. Meanwhile, there could be a surge in volatility as the RSI (14) moves above the 45-level.
Join Our Telegram channel to stay up to date on breaking news coverage