Join Our Telegram channel to stay up to date on breaking news coverage
BCH Price Prediction – February 18
The Bitcoin Cash eyes support at $650 after losing over 3.2% of its value on the daily trading.
BCH/USD Market
Key Levels:
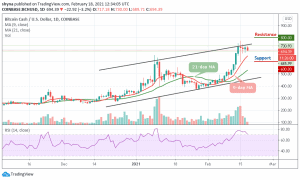
Resistance levels: $800, $850, $900
Support levels: $600, $550, $500

As the daily chart reveals, BCH/USD is currently trading with very low volatility as the market appears to be moving sideways for the past few days. Furthermore, the Bitcoin Cash has been oscillating between $675 and $750, with the buyers and sellers equally strong as the market price is seen hovering below the channel.
Where is BCH Price Going Next?
At the time of writing, the coin may be following the downtrend as the technical indicator RSI (14) is seen moving towards the south. Meanwhile, if the RSI (14) indicator crosses below the 70-level, it is likely that a break-out to the downside could be confirmed. However, while trading below this barrier, a bearish continuation may likely bring the price to the support levels of $600, $550, and $500.
Nevertheless, if the bulls hold the current value and push the price above the upper boundary of the channel, any further bullish movement could push the coin to the resistance levels of $800, $850, and $900. Presently, the technical indicator RSI (14) is seen moving within the overbought region, suggesting that a possible bullish movement may still come into play.
When compares with Bitcoin, the BCH price still remains within the downward trend as the sellers now gain momentum above the 9-day and 21-day moving averages around the upper boundary of the channel while the RSI (14) moves below the 60-level to keep the coin on the negative side.

Furthermore, according to the daily chart, sellers are seen putting more pressure in order to increase their entries. More so, in case the bears succeeded in breaking below the moving averages, traders would expect the market to fall to the support level of 1100 SAT and below. Meanwhile, a rebound may push the price above the upper boundary of the channel to hit the resistance level of 1600 SAT and above.
Join Our Telegram channel to stay up to date on breaking news coverage