Join Our Telegram channel to stay up to date on breaking news coverage
ETH Price Prediction – February 13
According to the daily chart, ETH/USD surged to a new all-time high of $1,871 after reaching the previous high a couple of days ago.
ETH/USD Market
Key Levels:
Resistance levels: $2100, $2200, $2300
Support levels: $1500, $1400, $1300
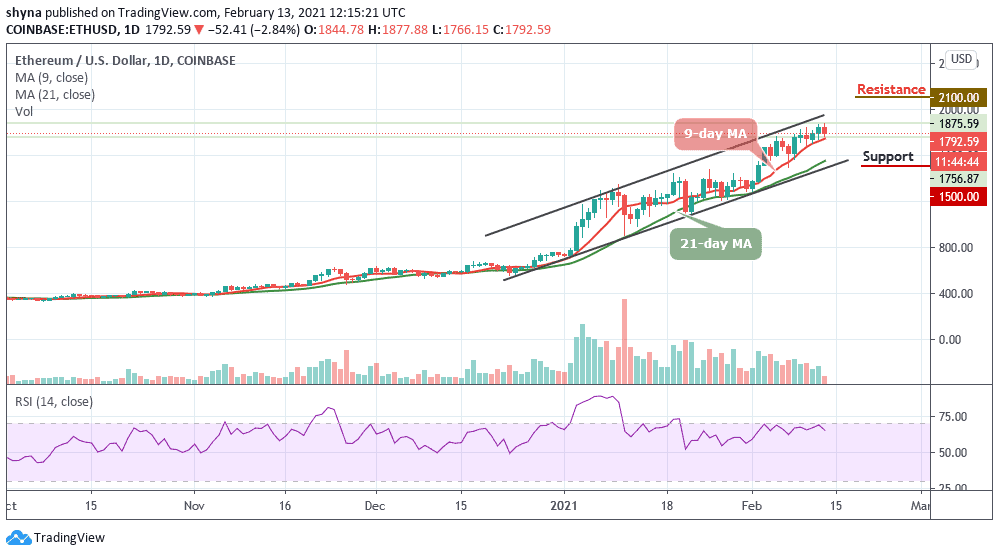
ETH/USD hit a new all-time high of $1877 today. The coin is down with -2.84% and hovering at $1792.59 amid fresh declines from the recent rejection at an all-time high of $1877.88. However, ETH/USD might complete the bearish leg to $1500 if a crucial support area is depressed.
What to Expect from ETH/USD
The bearish outlook may be abandoned if Ethereum closed the day above $1900 and perhaps touched the long-awaited resistance level of $2000. Meanwhile, the 9-day moving average seems to be holding the fort, allowing bulls to remain in control. This zone, in conjunction with the immediate support at $1700, must hold to ensure that potential losses to $1600 are averted. In addition, if the coin drops below the lower boundary of the channel, it could hit the supports at $1500, $1400, and $1300.
Moreover, as the coin stays above the moving averages, the upward price action might push the price of Ethereum above the upper boundary of the channel. Meanwhile, trading above $1900 is likely to encourage more buyers to join the market, thereby pulling the price to the potential resistance levels of $2100, $2200, and $2300. Presently, the technical indicator RSI (14) is moving below the 75-level, suggesting a bearish signal.
When compares with Bitcoin, the Ethereum price is seen following the upward movement as the pair trades below the 9-day and 21-day moving averages. The market price may remain below the barrier if the 9-day MA crosses below the 21-day MA. The RSI (14) indicator stays below 50-level, which might be considered as more downtrends for the market.
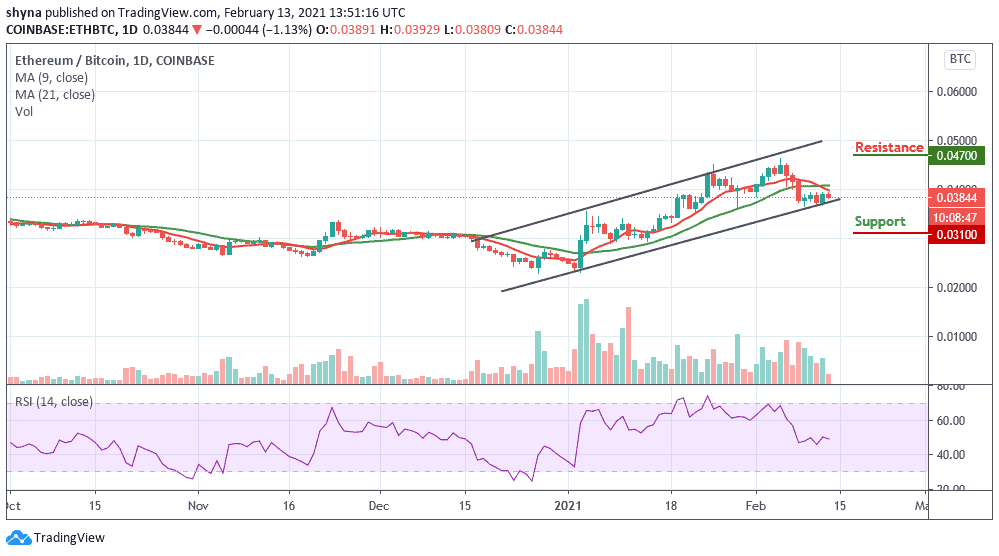
Therefore, any further bearish movement below the lower boundary of the channel may drag the coin to the support levels of 3100 SAT and below. Moreover, if there is a rebound, the Ethereum price may likely go up to cross above the moving averages to hit the resistance level of 4700 SAT and above.
Join Our Telegram channel to stay up to date on breaking news coverage