Join Our Telegram channel to stay up to date on breaking news coverage
ETH Price Prediction – January 26
It is likely for Ethereum (ETH) to lose traction as a breakdown to $1200 lingers.
ETH/USD Market
Key Levels:
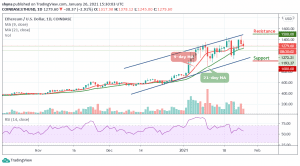
Resistance levels: $1500, $1550, $1600
Support levels: $1000, $950, $900

As the daily chart reveals, ETH/USD is yet to clear the hurdle at $1500 following the fall from the new yearly high of around $1477. The bears seem to be gaining momentum under the short-term resistance, despite the fact that the coin trades above the 9-day and 21-day moving averages. On the downside, support is provided by the 21-day moving average.
Where is Ethereum Price Going Next?
On the upside, the Ethereum (ETH) may abandon the bearish outlook if the price closes the day above $1300. More so, suppose stability comes into the market above this crucial level, the buyers could have time to plan the coin for gains above the $1400 resistance level. Therefore, any further bullish movement across the upper boundary of the channel could locate the potential resistance levels at $1500, $1550, and $1600 respectively.
On the downside, if the price drops below the 9-day and 21-day moving averages, the coin is likely to locate the critical support at $1200 which is a close support level for the bears. However, a bearish continuation could bring the market to $1000, $950, and $900 support levels. Nevertheless, the trend may move sideways as the technical indicator RSI (14) moves in the same direction above the 60-level.
When compares with BTC, Ethereum is trading above the 9-day moving average and the price is now hovering at 4179 SAT as the technical indicator RSI (14) moves to cross above the 70-level to move into the overbought region. However, the bulls remain the dominant of the market as the pair seems to be moving towards the north.
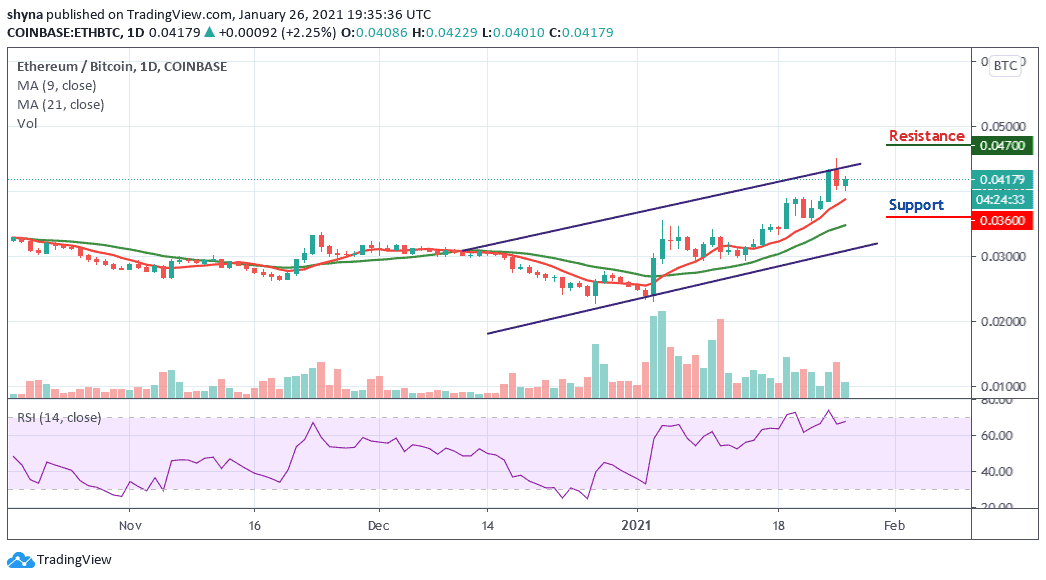
Moreover, if the price drop below the moving averages, the support levels to be reached are 3600 SAT and 3400 SAT. On the other hand, a higher sustainable move above the upper boundary of the channel could attract new buyers coming into the market with the next focus on 4722 SAT and 4900 SAT resistance levels.
Join Our Telegram channel to stay up to date on breaking news coverage