Join Our Telegram channel to stay up to date on breaking news coverage
ETH Price Prediction – January 23
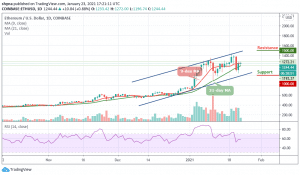
Looking at the daily chart, Ethereum (ETH) has been trading in a tight range since the first week of this month.
ETH/USD Market
Key Levels:
Resistance levels: $1500, $1600, $1700
Support levels: $1000, $900, $800
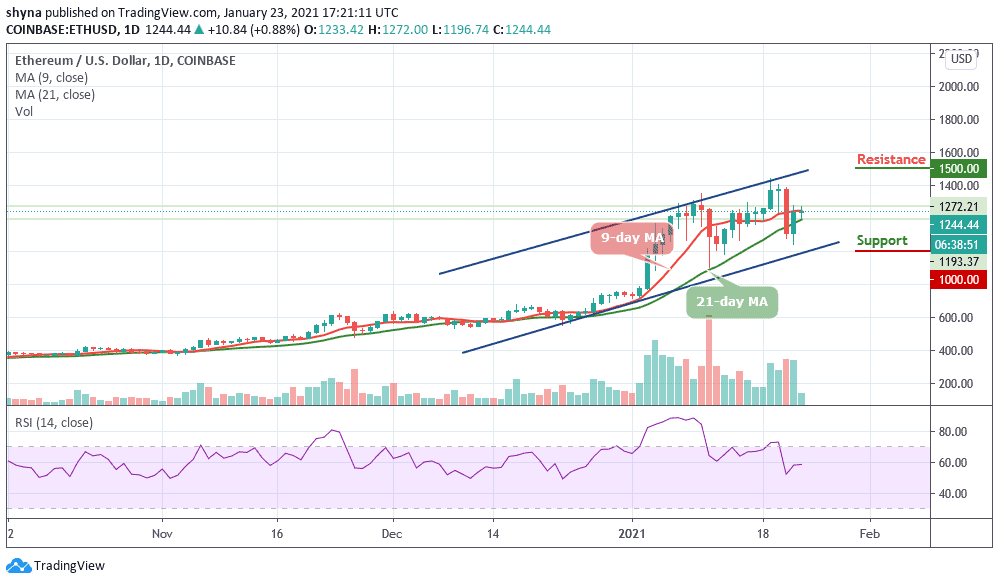
According to the daily chart, ETH/USD has been surging immensely since breaking above the 9-day and 21-day moving averages pushing above $1200 to reach as high as $1272 today. However, ETH/USD seems to be struggling with specific resistance at $1244. However, the Ethereum price also spiked lower two days ago to bounce into the $1081 support.
What to Expect from Ethereum (ETH)
Currently, the price of the coin is changing hands above the 9-day and 21-day moving averages and the bulls are performing too well in pushing it to the upside. In other words, any reversal to the south may likely welcome the resumption of the bears into the market which could probably drag the coin towards the critical supports at $1000, $900, and $800.
Nonetheless, the technical indicator RSI (14) is preparing to cross above the 60-level and move to the upside, which indicates the continuation of the bullish trends and further resistance may be found at $1500, $1600, and $1700 levels.
Comparing with BTC, the Ethereum (ETH) is currently changing hands at 0.038 BTC after witnessing some bullish moments in the last two days while the current trend of the coin still remains the same as the bulls are now pushing the coin above the 9-day and 21-day moving averages.
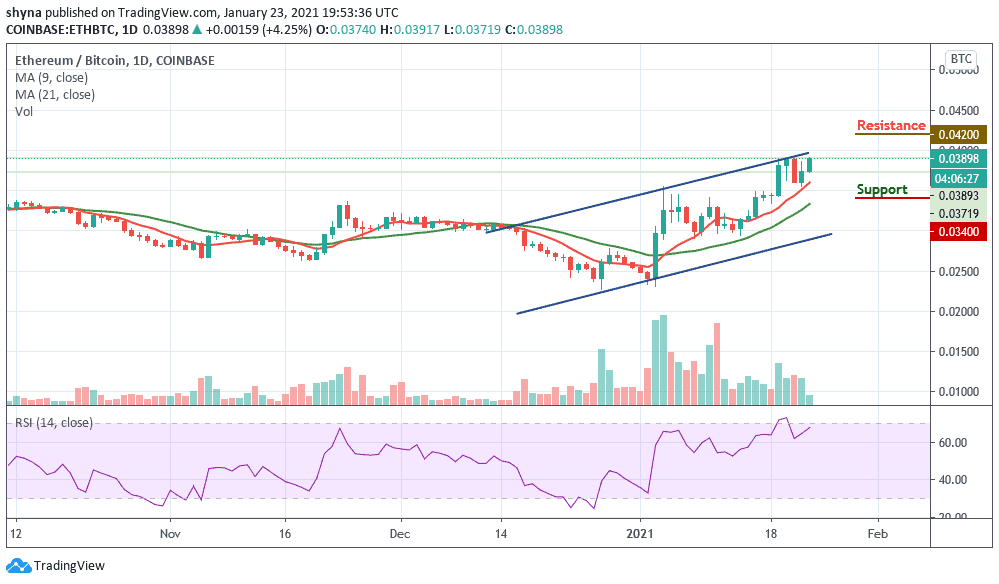
Moreover, if the bulls could forge ahead, breaking above the channel could meet the resistance level at 0.042 BTC and above. However, Ethereum is currently preparing for more upsides and may soon cross above the upper boundary of the channel in the positive moves. Meanwhile, the technical indicator RSI (14) is likely to cross into the overbought region, which suggests the bulls may fully step into the market.
Join Our Telegram channel to stay up to date on breaking news coverage