Join Our Telegram channel to stay up to date on breaking news coverage
ETH Price Prediction – January 7
In the early hours of today, the price of Ethereum is seen rising from $1140 to $1291 level.
ETH/USD Market
Key Levels:
Resistance levels: $1500, $1600, $1700
Support levels: $1000, $900, $800
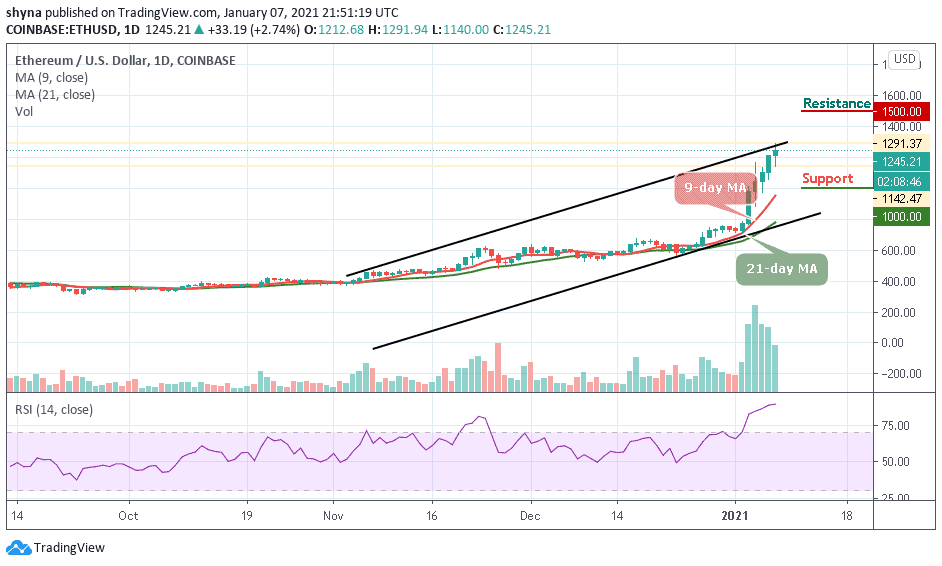
At the moment, the market is rising as ETH/USD could not climb much higher from the $1212 level within the ascending channel. Today’s decline was largely attributed to the fact that ETH/USD plummeted pretty significantly. ETH/USD is moving above the moving averages but it can rise higher and break above the upper boundary of the channel at $1400. If ETH/USD falls and drops beneath the support of $1200, the coin may turn bearish.
What to Expect from Ethereum (ETH)
If the sellers step back into the market to add downward pressure to ETH, initial support is expected at $1000. Beneath this, support can be found at $900 and $800. On the other hand, if the bulls can defend the $1250 level and allow ETH to rebound, an initial resistance may be located at $1400. Above this, additional resistance is expected at $1500, $1600, and $1700 levels.
More so, the technical indicator RSI (14) is moving within the overbought zone showing that the previous bullish momentum may soon fade. If the technical indicator manages to make a quick turn-back, then the bulls stand a chance to allow Ethereum to retreat. However, if it penetrates beneath, the cryptocurrency may resume a downward movement.
Again Bitcoin, the market price remains with the channel as the coin moves sideways. ETH/BTC is currently trading at 0.0317 BTC and the bulls couldn’t push the price above the upper boundary of the channel. Looking at the daily chart, if the market continues to drop towards the moving averages, the next key supports may be located at 0.0290 BTC and below.
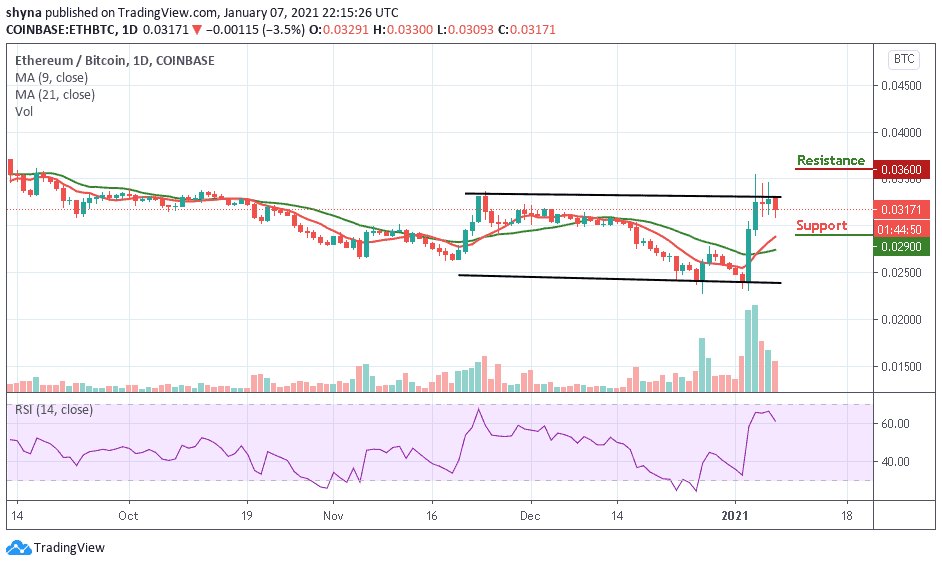
However, considering the upside, a possible bullish movement may likely push the market price above the channel, immediately after this is done, the resistance level of 0.0360 BTC and above may be visited. Meanwhile, the technical indicator RSI (14) is moving below $62 and this indicates a bearish momentum in the market.
Join Our Telegram channel to stay up to date on breaking news coverage