Join Our Telegram channel to stay up to date on breaking news coverage
ETH Price Prediction – December 13
The Ethereum (ETH) needs to pull above the $600 resistance level quickly so as to deny the bears the opportunity to enter and reverse the accrued gains.
ETH/USD Market
Key Levels:
Resistance levels: $650, $670, $690
Support levels: $520, $500, $480
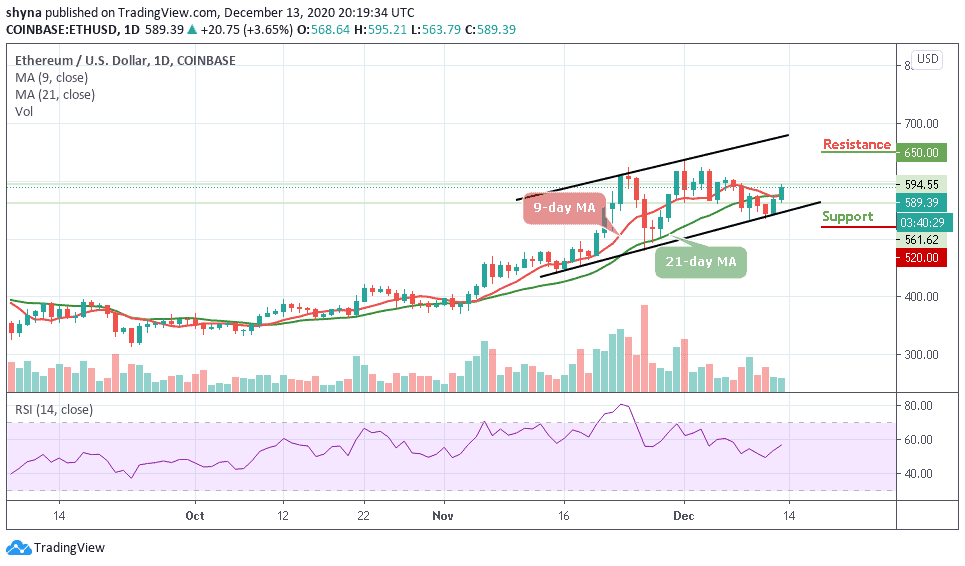
Today, majority of the altcoins in the market are posting incredible gains after what looks like a successful weekend session. In addition, ETH/USD bullish action extended above the $570 resistance level and move towards a $600 level. Meanwhile, an intraday high was formed at $595.
What to Expect from Ethereum (ETH)
The current technical levels suggest that the bulls are not yet done because the longer they stay under the $600 resistance level, the more they allow the sellers to regroup and force a reversal which could lead to support levels of $520, $500, and $480 respectively. For now, the trend is in the bulls’ hands as the RSI (14) is now moving further towards the north.
Moreover, as long the price stays above the 9-day and 21-day moving averages, bulls may remain relatively in charge and the next significant resistance could be $620, which may give way for gains towards the $650, $670, and $690 resistance levels.
Comparing with Bitcoin, the market price remained within the channel as the coin keeps moving sideways. ETH/BTC is currently trading at the level of 0.030 BTC and bulls have not been able to push the price above the 9-day and 21-day moving averages. Looking at the chart, if the market begins to drop, the next key supports may likely be at 0.028 BTC and below.
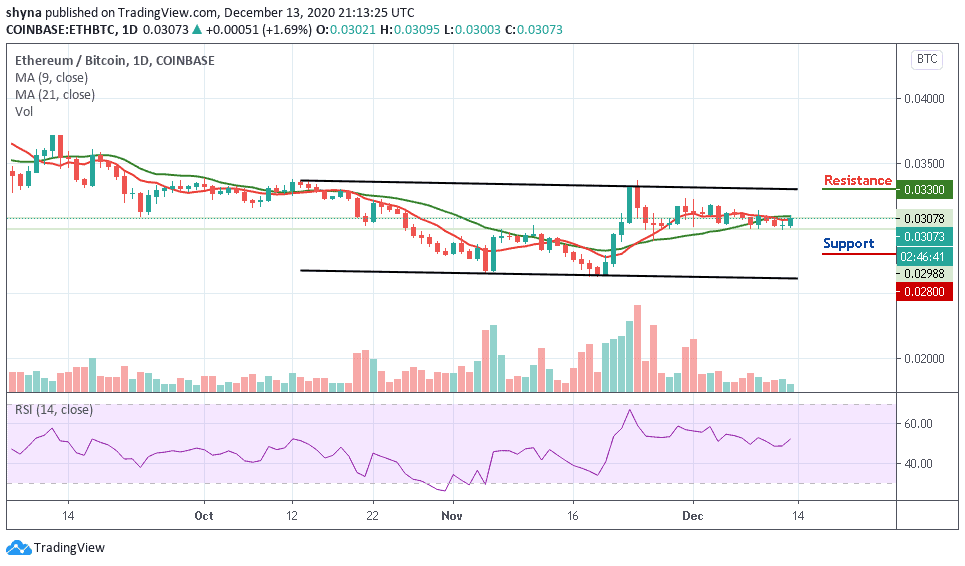
However, on the upside, a possible bullish movement may likely push the market above the moving averages, once this is done, the resistance level of 0.033 BTC and above may be visited. Meanwhile, the technical indicator RSI (14) is moving above the 50-level and this is to indicate that the market may begin to rise.
Join Our Telegram channel to stay up to date on breaking news coverage