Join Our Telegram channel to stay up to date on breaking news coverage
ETH Price Prediction – December 8
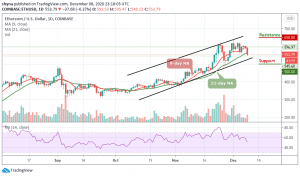
Ethereum price is seen diving below the moving averages and it may continue to move down towards $500 if it fails to stay above $550.
ETH/USD Market
Key Levels:
Resistance levels: $650, $670, $690
Support levels: $500, $480, $460

The daily chart reveals that ETH/USD is seen trading below the 9-day and 21-day moving averages. The crypto touches the daily low of $548.12 at the time of writing. Meanwhile, the buyers blamed the $570 nearest support for boosting bears’ pressure on the market. However, the support areas of between $550 and $540 have been well established.
What to Expect from ETH
Looking at the daily chart, ETH/USD is trading below the 9-day and 21-day moving averages at $553 at the time of writing, trying to recover from the intraday low of $548. However, ETH/USD, with a current market value of $62.87 billion is currently losing 6.37% of its value in the last few hours. Mere looking at the daily chart, the Ethereum price continues to follow the downtrend but still within the channel, and any attempt to break below the channel, the bears may reach the nearest support at $500, $480, and $460 levels.
Conversely, if bulls push the price above the moving averages and maintain the upward movement within the channel, the buyers may find resistance at $650, $670, and $690 respectively. In other words, the RSI (14) indicator is facing the negative side, suggesting more bearish signals into the market.
Against Bitcoin, the market price remained within the channel as the coin begins to move sideways. ETH/BTC is currently trading at the level of 0.0302 BTC and the bulls couldn’t push the price above the 9-day moving average. Looking at the chart, if the market continues to drop, the next key supports may likely be at 0.0260 BTC and below.

However, on the upside, a possible bullish movement may likely push the market above the upper boundary of the channel to reach the resistance level of 0.0345 BTC and above. The technical indicator RSI (14) is moving below the 50-level and this indicates that the market may continue to fall.
Join Our Telegram channel to stay up to date on breaking news coverage