Join Our Telegram channel to stay up to date on breaking news coverage
Bitcoin (BTC) Price Prediction – December 8
BTC/USD bulls have been in full control of the cryptocurrency’s price action as they are losing their edge over sellers.
BTC/USD Long-term Trend: Bullish (Daily Chart)
Key levels:
Resistance Levels: $20,500, $20,700, $20,900
Support Levels: $17,500, $17,300, $17,100
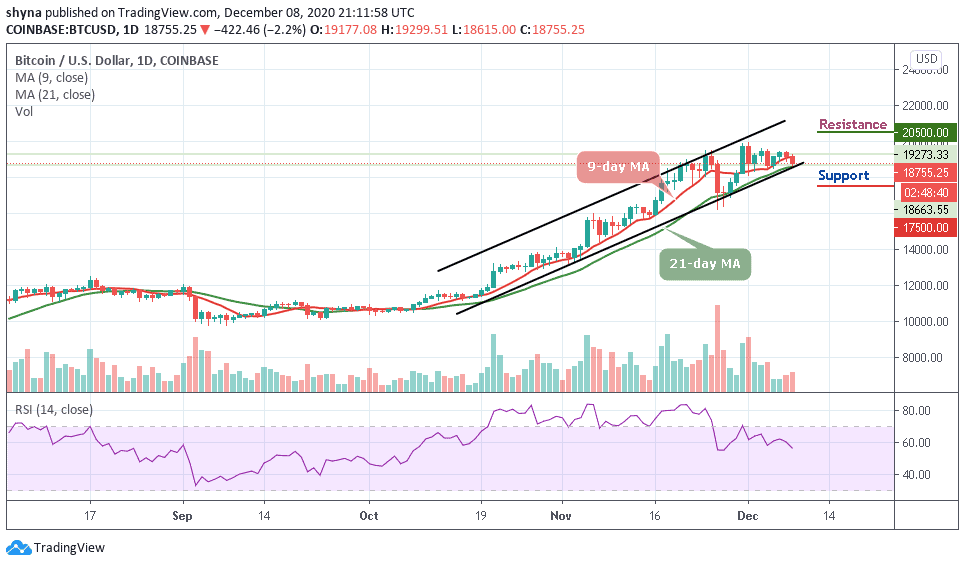
At the time of writing, BTC/USD is trading down by 2.2% at its current price of $18,755. This is the spot where the coin has been trading for the past few days, with the selling pressure seen in the $19,000 region proving significant. Moreover, where the coin may go next could depend on whether or not bulls can take control of it before it breaks below $18,600 or $18,400.
Would Bitcoin Go Up or Down?
The latest price reduction has made Bitcoin’s price to see a sharp cut of over $500, amounting to a 2.2% loss as it moves toward the south. In the time following this rally, BTC/USD has been making an effort to erase the gains accrued a few days ago, with the crypto plummeting to lows of $18,600 before climbing slightly to its current price of $18,755.
Nevertheless, the price corrections of today have traced a falling flag which has been breached very recently. Meanwhile, looking at the daily chart, $17,500, $17,300, and $17,100 serves as the major support levels, making room for BTC/USD to fall even further. The RSI (14) for the coin has just nosedives to the 55-level. Conversely, BTC/USD may see resistance levels at $20,500, $20,700, and $20,600 if climb above the moving averages.
BTC/USD Medium – Term Trend: Ranging (4H Chart)
On the 4-hour chart, we can see that bears are stepping back into the market, trading below the 9-day and 21-day moving averages but breaking below the lower boundary of the channel may cause to fall more. Meanwhile, the $18,200 and below may be visited if BTC/USD breaks the mentioned barrier.
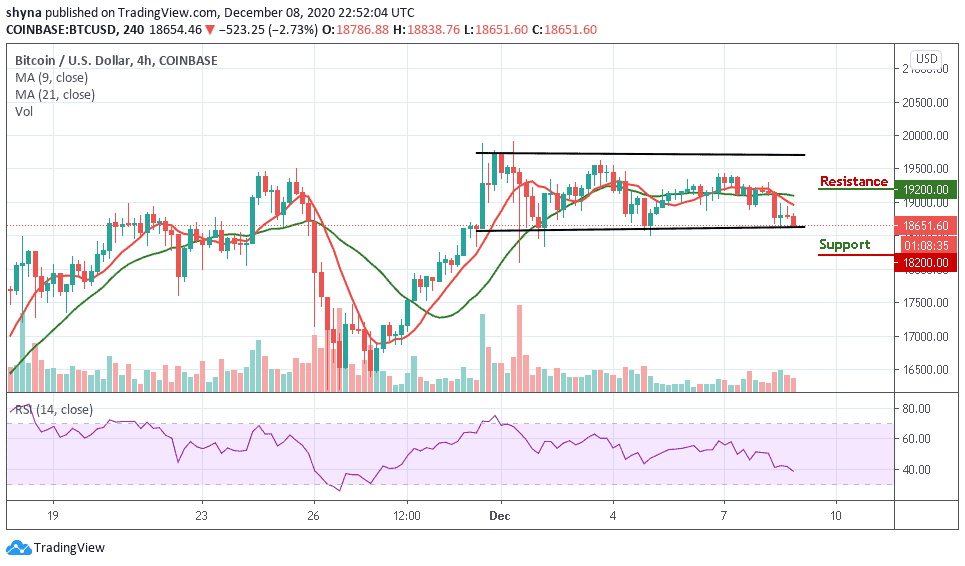
However, if buyers can push the market above the 9-day and 21-day moving averages, traders may expect a retest at the $19,000 resistance level. Breaking the mentioned resistance may further allow the bulls to test the $19,200 and above on the upside but the RSI (14) is crossing below the 40-level indicating additional bearish signals.
Join Our Telegram channel to stay up to date on breaking news coverage