Join Our Telegram channel to stay up to date on breaking news coverage
ETH Price Prediction – December 2
It is likely for Ethereum (ETH) to lose traction as a breakdown to $550 lingers.
ETH/USD Market
Key Levels:
Resistance levels: $680, $700, $720
Support levels: $500, $480, $460
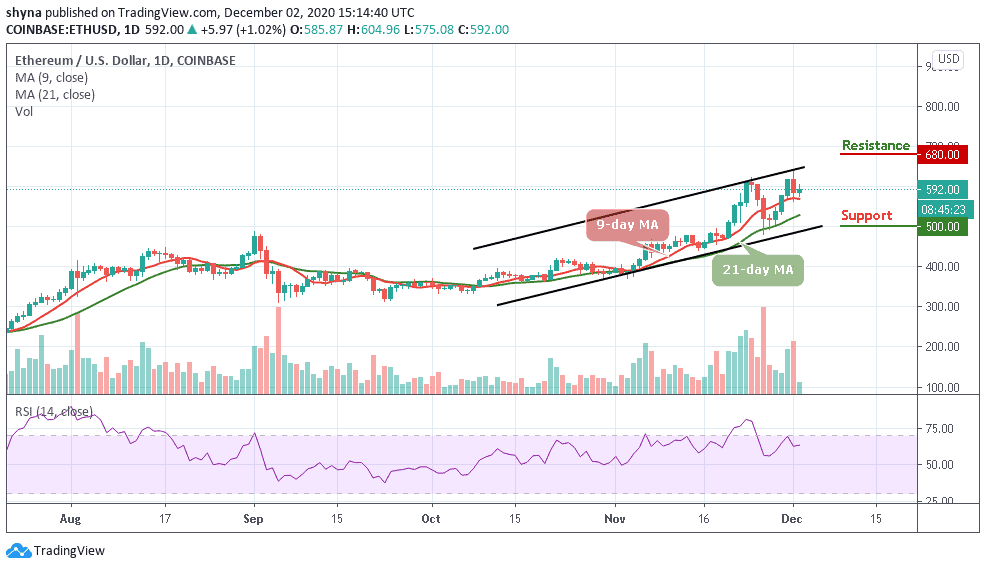
According to the daily chart, ETH/USD is yet to clear the hurdle at $600 following the fall from the new yearly high of around $636. The bears seem to be gaining momentum under the short-term resistance, despite the fact that the coin trades above the 9-day and 21-day moving averages. On the downside, support is provided by an ascending trend-line.
What to Expect from ETH/USD
On the upside, the Ethereum (ETH) may abandon the bearish outlook if the price closes the day above $600. Moreover, suppose stability comes into the market above this crucial level, the buyers could have time to plan the coin for gains above the $700 resistance level. Therefore, any further bullish movement across the upper boundary of the channel could locate the potential resistance levels at $680, $700, and $720 respectively.
On the downside, if the price drops below the 9-day and 21-day moving averages, the coin is likely to locate the critical support at $520 which is a close support level for the bears. However, a bearish continuation could bring the market to $500, $480, and $460 support levels. Nevertheless, the trend may move sideways as the technical indicator RSI (14) moves in the same direction above the 60-level.
Against Bitcoin, the recent price decline continues to place the Ethereum price on a range-bound after witnessing a bullish price action a few days ago, More so, the price action is currently trading above the 9-day and 21-day moving averages. Looking at a long-term bear market, the 0.028 BTC, 0.026 BTC, and 0.024 BTC could provide further support levels for the next selling pressure.
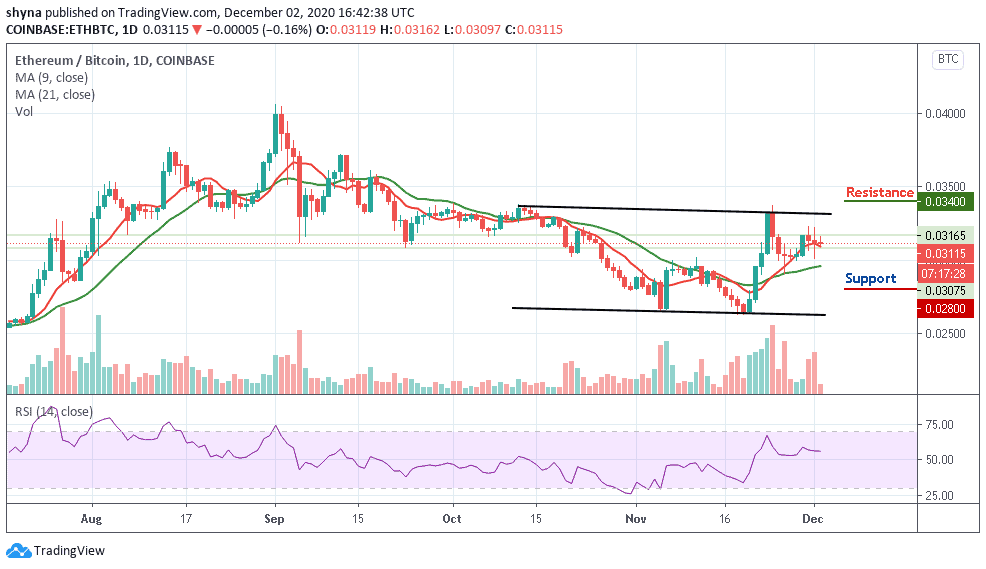
Moreover, according to the daily chart, the sellers may likely return to the market after a little indecisive appearance. However, if the 0.031 BTC can act as a solid line of defense against any further downtrend; buy pressure at 0.034 BTC, 0.036 BTC and 0.038 BTC resistance levels may come to play. Meanwhile, the RSI (14) is currently moving sideways above the 50-level.
Join Our Telegram channel to stay up to date on breaking news coverage