Join Our Telegram channel to stay up to date on breaking news coverage
ETH Price Prediction – November 24
Ethereum (ETH) is witnessing some intense selling pressure following its latest push higher, with bulls trying to defend $600.
ETH/USD Market
Key Levels:
Resistance levels: $680, $700, $720
Support levels: $550, $530, $510
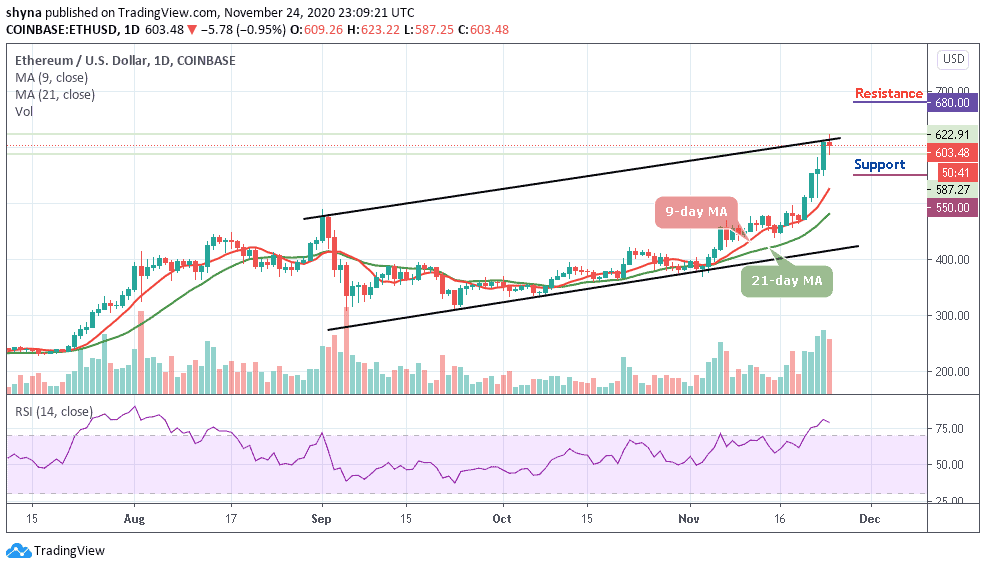
ETH/USD is seen trading at $603 after recording an intraday high at $623 today. At the time of writing, Ethereum (ETH) is down by 0.95% at its current price of $603.48. Despite the decline, the technical indicator RSI (14) remains within the overbought region; showing support and resistance forces in the trade. Though buying pressure is much dominant than selling but at the moment, price heads downward.
Where is ETH Price Going Next?
ETH/USD can be expected to rise to $650 over the next few days while the on-going trend may move a little bit higher in the coming days. The Ethereum price may cross above the channel to touch the nearest resistance at $630. Therefore, as the red-line of 9-day MA moves above the green-line of 21-day MA, the coin may continue to do well and the price could probably hit the potential resistance levels at $680, $700, and $720 respectively.
However, should the technical indicator decide to make a quick turn from the overbought, there may be a bearish movement towards the 9-day and 21-day moving averages and this bearish drop could roll the market down to the supports of $550, $530, and $510.
When compares with Bitcoin, as the red-line of the 9-day MA is crossing above the green-line of the 21-day MA, this simply means that the market price may focus on the uptrend within the channel. More so, ETH/BTC is currently trading at the 3156 SAT and if the market continues to rise, the next key resistance may be at 3500 SAT and above.
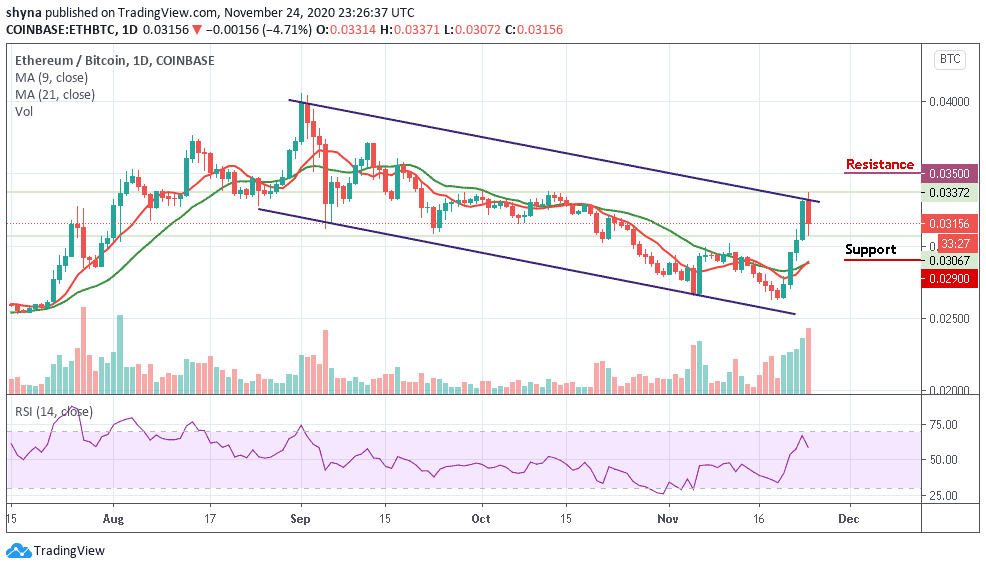
On the downside, a possible bearish movement below the moving averages may likely come into play if the coin continues to fall as the daily chart reveals, once this is done, the support level of 2900 SAT and below could be visited. Meanwhile, the market may continue to have a bearish day today because the RSI (14) nosedives below the 65-level, suggesting more bearish signals.
Join Our Telegram channel to stay up to date on breaking news coverage