Join Our Telegram channel to stay up to date on breaking news coverage
BCH Price Prediction – November 24
BCH/USD is following bullish sentiment as the daily chart reveals while the sellers are waiting to scalp gains from potential pullbacks.
BCH/USD Market
Key Levels:
Resistance levels: $400, $410, $420
Support levels: $280, $270, $260
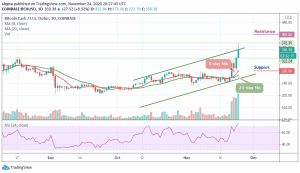
BCH/USD keeps maintaining the positive side but the coin needs enough momentum to hit $400. Following the recent price, Bitcoin Cash faces a potential resistance at the $372 level above the upper boundary of the channel. A break above this is likely to produce a huge green candle to the upside.
What to Expect from BCH
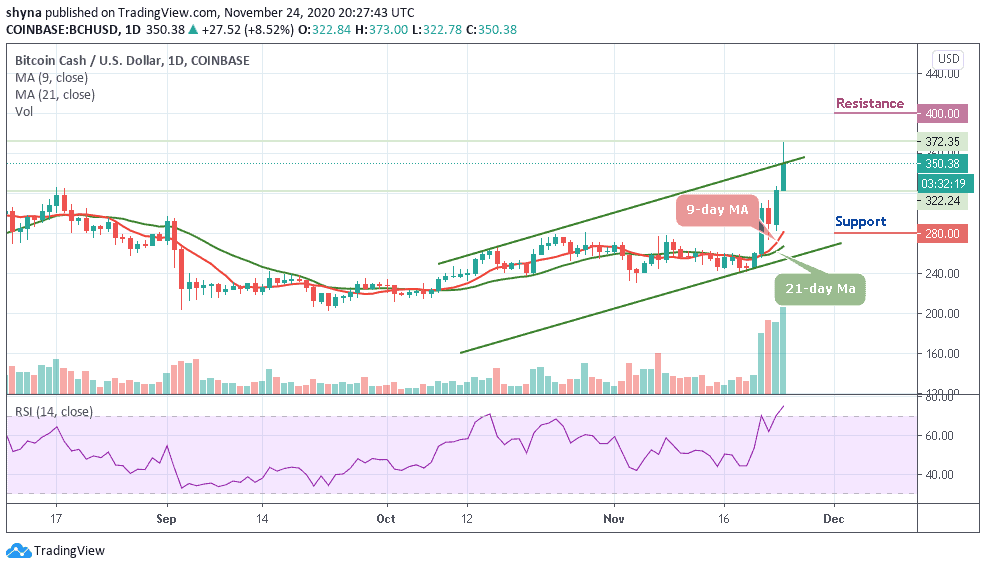
Looking at the daily chart, BCH/USD is changing hands at $350.38 and if the market price drops further, it could slump below the 9-day and 21-day moving averages which may likely hit the support levels of $280, $270, and $260, after crossing below the lower boundary of the channel.
However, we can see that the trading volume is rising, giving a sign of an upcoming big move. More so, the technical indicator RSI (14) signal line is moving into the overbought region due to the price increase where a precise bullish cross might reveal more buy signals for the market. A strong buying pressure may continue to push the price to the $380 resistance level.
Meanwhile, a bullish continuation may likely push the coin to hit the potential resistance levels at $400, $410, and $420. Regardless of the above, the Bitcoin Cash price is considered bullish as the technical indicator is moving towards the north.
By comparing against Bitcoin, the daily chart reveals that the bulls are now showing some commitment to the market movement. However, following the recent positive signs, the trend may continue to go up if the buyers continue to pump more pressure into the market.
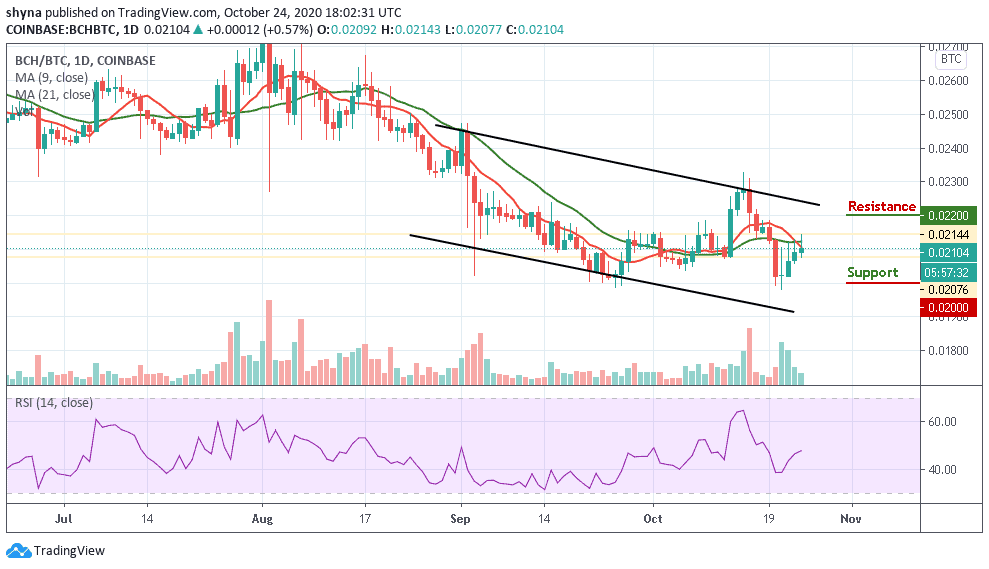
However, as the technical indicator RSI (14) moves to cross above 60-level, if the bulls can put more effort, the market price may continue to follow an upward movement, pushing further can take it to the resistance level of 0.022 BTC and above but a retest could lower the price below the 9-day and 21-day moving averages. The further bearish movement could drag it to the supports at 0.015 BTC and below.
Join Our Telegram channel to stay up to date on breaking news coverage