Join Our Telegram channel to stay up to date on breaking news coverage
Bitcoin (BTC) Price Prediction – November 24
The Bitcoin price is now in touching distance of its all-time high of $20,000. Will it get there?
BTC/USD Long-term Trend: Bullish (Daily Chart)
Key levels:
Resistance Levels: $20,800, $21,000, $21,200
Support Levels: $17,000, $16,800, $16,600
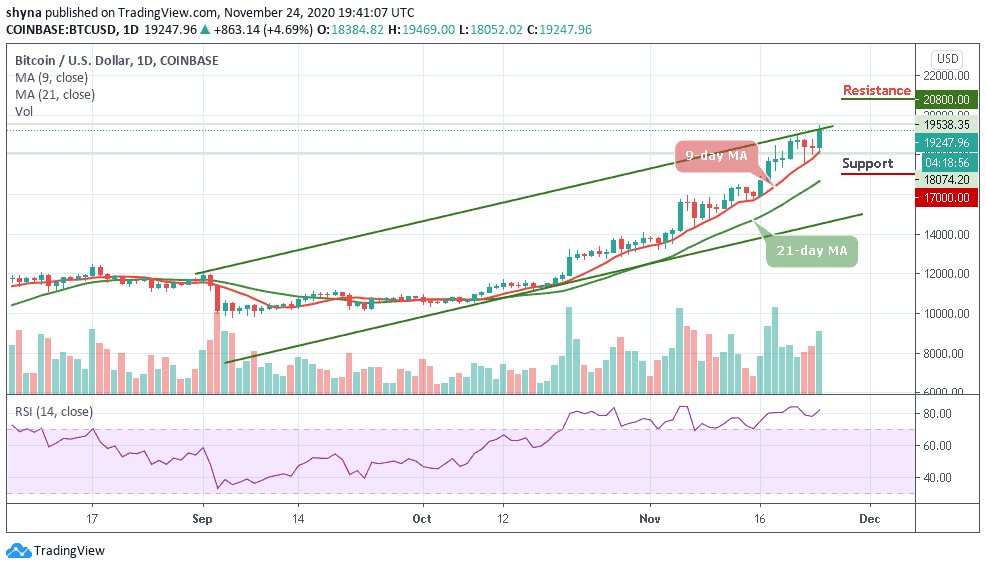
BTC/USD climbs above $19,400 for the first time in almost three years. The uptrend comes on the back of months of sustained highs as the coin recouped all the losses from the past months early this year. However, there have only been a few pullbacks on the way up, the technical indicator RSI (14) remains extremely overextended but doesn’t necessarily pose any form of threat for the bulls as the market movement is simply too strong right now.
What to Expect from Bitcoin (BTC)
If the first digital asset hits the $20,000 resistance, traders should note that any rejection from this level could have a devastating effect on BTC/USD as many long positions could get liquidated fast if there is a massive trigger of orders. Therefore, a few percent below those highs may still be situated above key support levels. However, the long-term trend of Bitcoin remains positive as the fundamental trends still favor long-term growth.
Nevertheless, as the new uptrend movements are beginning to form, buyers may use the 9-day MA as the nearest support level. But in as much the RSI (14) remains within the overbought zone, the market may continue to follow the upward movement and the potential resistance levels may be located at $20,800, $21,000, and $21,200 while the supports lie at $17,000, $16,800 and $16,600.
BTC/USD Medium-Term Trend: Bullish (4H Chart)
On the 4-hour chart, BTC/USD is currently trading around $19,176 above the 9-day and 21-day moving averages. Meanwhile, we can see that after the tremendous performance of the coin, the bears are now trying to drag it down. However, if the buyers could strengthen and energize the market, they can further push the price to a $19,600 resistance level.
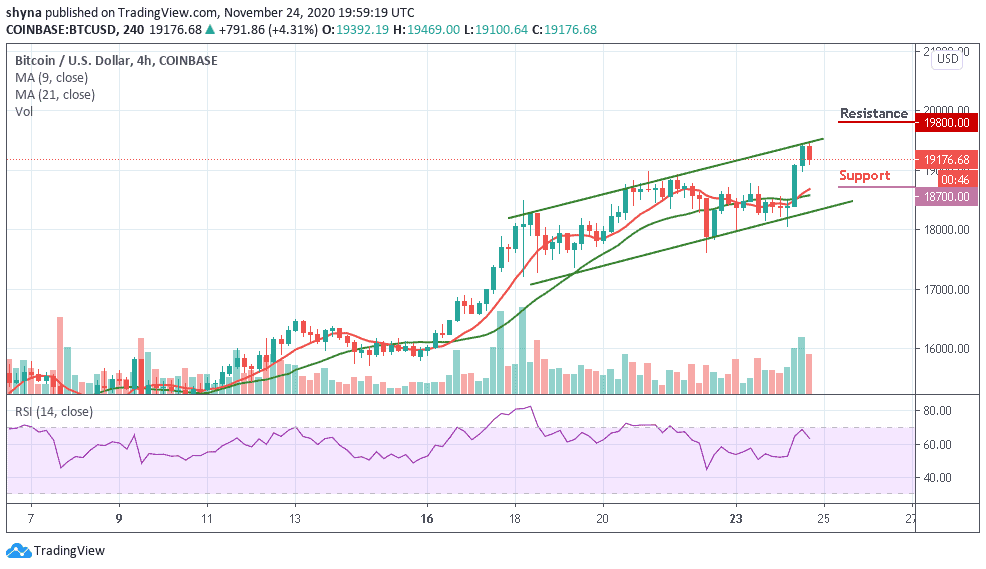
Therefore, breaking the mentioned resistance could also allow the bulls to test the $19,800 and above. More so, the technical indicator RSI (14) is seen moving towards the 70-level, but any bearish movement may welcome the sellers into the market which could drag the price below the moving average, which could reach the support level of $18,700 and below.
Join Our Telegram channel to stay up to date on breaking news coverage