Join Our Telegram channel to stay up to date on breaking news coverage
ETH Price Prediction – October 24
The daily chart reveals that ETH/USD is keeping its upward movement, while the sellers are frustrating the movement.
ETH/USD Market
Key Levels:
Resistance levels: $450, $460, $470
Support levels: $375, $365, $355

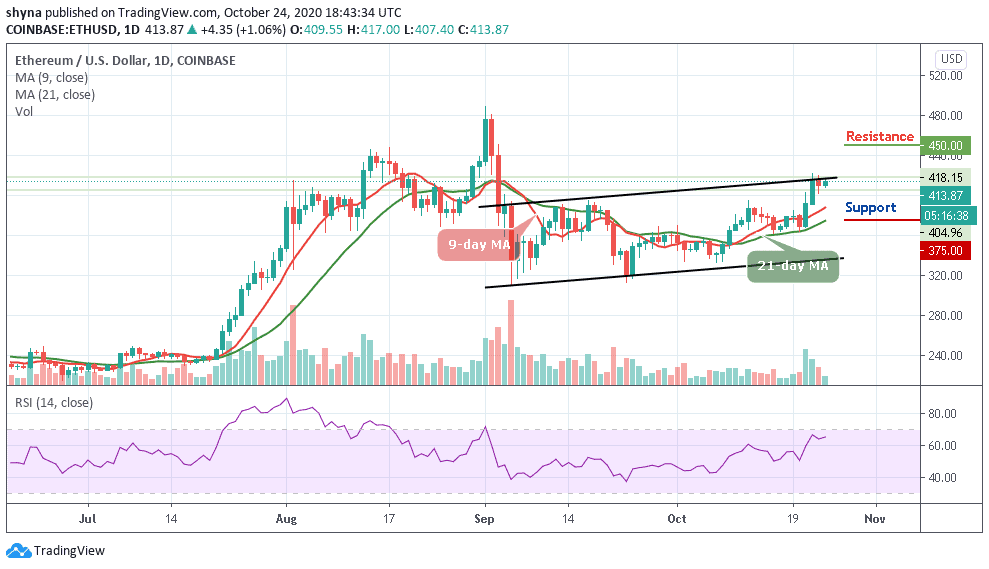
ETH/USD has been remarkably slow in its movement since October 22 when the coin touched the monthly high of $421. The lethargic movement follows a lower correction from highs around $417 and the failure to break above this level must have discouraged the bulls while giving Ethereum bears a gap to explore.
Where is ETH Price Going Next?
At the time of writing, ETH/USD is trading above the 9-day and 21-day moving averages with just a 1.06% gain at its current price of $413.87. This is around the price at which it has been consolidating following its recent rejection at $420 a couple of days ago. Meanwhile, a firm break above this level could spark buying pressure that may help to push its price up to a new high.
Moreover, for a backward movement, the market may be supported at levels of $400 and $390 and if the price falls below these levels, other supports are below the moving averages at $375, $365, and $355. But should in case the price exceeds the indicated level of $413, then, the resistance levels of $450, $460, and $470 may be visited. The technical indicator RSI (14) is moving around 65-level, suggesting a sideways movement.
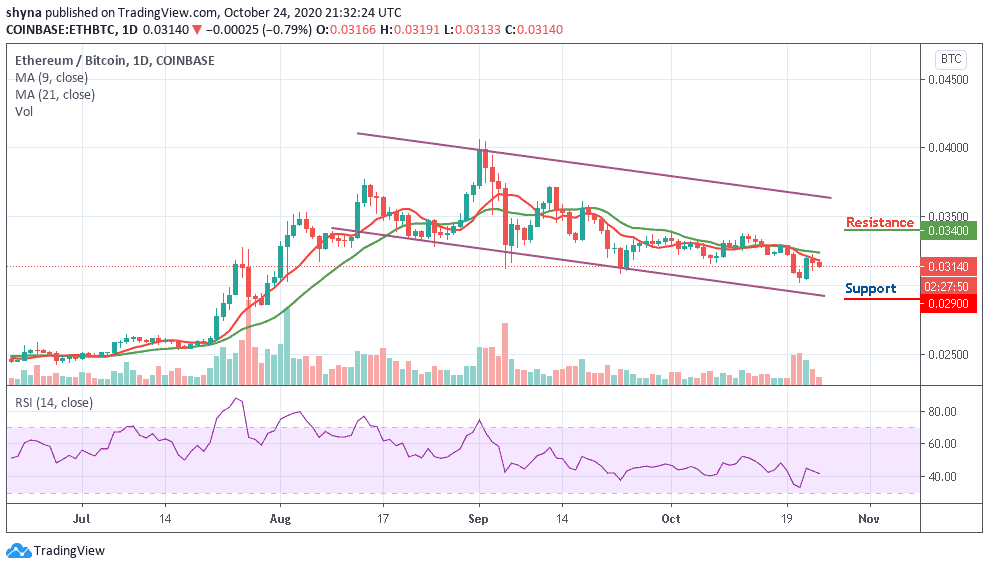
Against Bitcoin, the market price is seen falling below the 9-day and 21-day moving averages and the technical indicator RSI (14) also confirms the bearish movement as the signal line moves below the 45-level.

Moreover, the market price may continue to decline if the coin remains below the moving averages and this may bring the price down to the support levels of 0.029 BTC, 0.028 BTC, and 0.027 BTC. Therefore, if ETH/BTC bulls can gather more effort and push the price above the moving averages; this could lead the coin to the resistance levels of 0.034 BTC, 0.035 BTC, and 0.036 BTC respectively.
Join Our Telegram channel to stay up to date on breaking news coverage

