Join Our Telegram channel to stay up to date on breaking news coverage
ETH Price Prediction – October 19
Ethereum price has been up by almost 0.5% in the last few hours, and it is currently hovering around $380
ETH/USD Market
Key Levels:
Resistance levels: $425, $435, $445
Support levels: $325, $315, $305

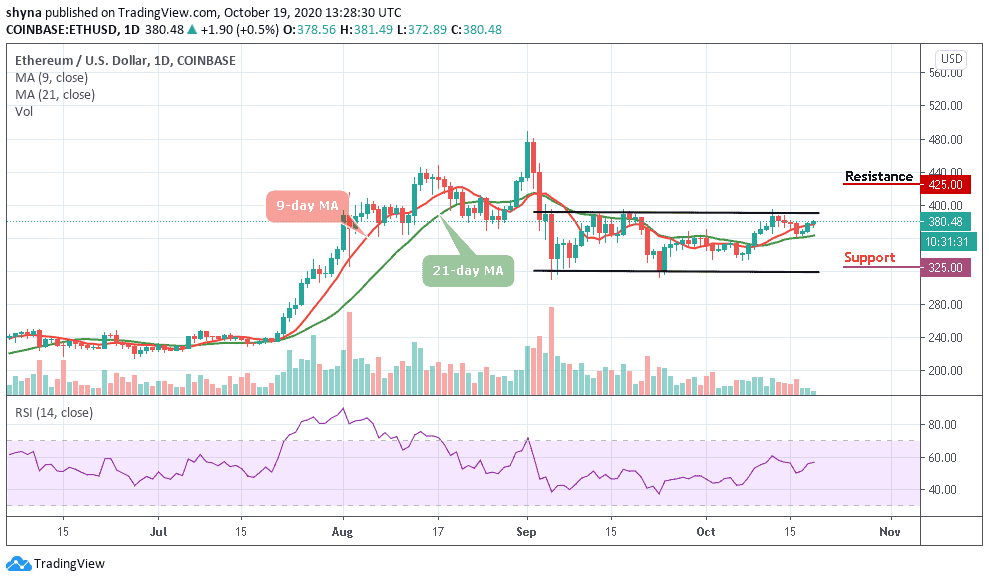
At the time of writing, ETH/USD is seen trading at 380.48 after touching the low of $372 at the opening hour of today. Looking at the daily chart, Ethereum (ETH) has been trying to follow in the footsteps of Bitcoin but its margin of gains has been limited this time around. ETH/USD has been moving sideways since last month but traders should continue to monitor the coin for the next direction.
What to Expect from ETH/USD
ETH/USD bulls are not giving up on the mission to pull above $400 despite this month’s low of $332. Meanwhile, the second digital asset is trading at $380.48. The 9-day moving average is seen hindering the movement towards the upside. However, more resistance may likely play out at $390 before reaching the most important resistance level of $400. Any further bullish movement above the upper boundary of the channel may hit the potential resistance levels of $425, $435, and $445 respectively.
On the downside, buyers need to hold the price above the 9-day and 21-day moving averages. Otherwise, a breakdown might continue within the channel. In case of a reversal, support is anticipated at the 21-day moving average. More so, the critical supports are located around $325, $315, and $305 while the technical indicator RSI (14) is seen moving above 55-level, which may continue to give more bullish signals.
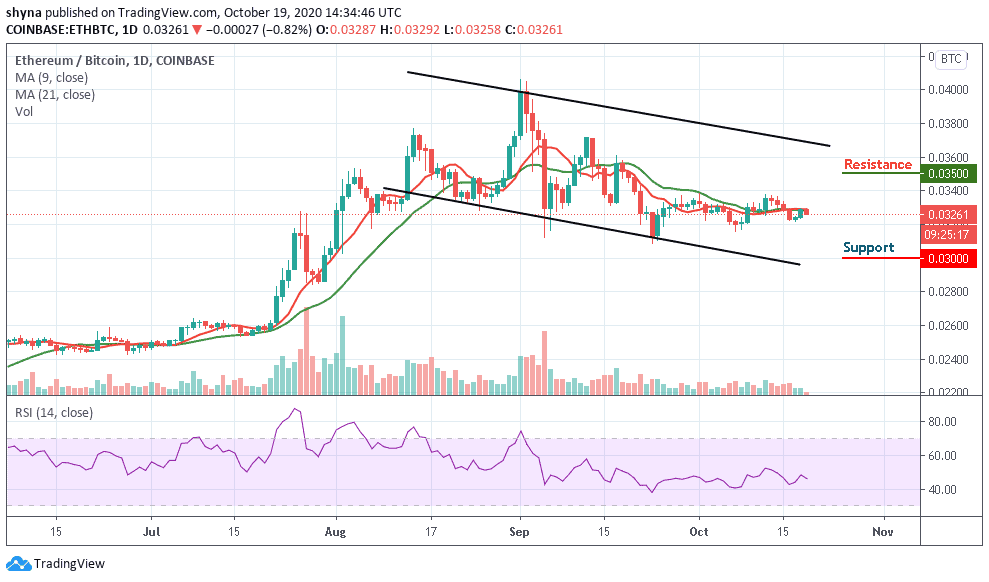
When compares with BTC, the Ethereum price remains with the channel as the coin moves sideways. ETH/BTC is currently trading at the level of 0.0326 BTC as the bulls fail to push the price above the 9-day and 21-day moving averages. Looking at the chart, if the market begins to drop below the moving averages, the next key supports may likely be at 0.0300 BTC and below.

However, considering the upside, a possible bullish cross may push the coin above the moving averages as the resistance level of 0.0350 BTC and above could be visited. Meanwhile, the RSI (14) is moving below the 50-level and this indicates a bearish momentum in the market.
Join Our Telegram channel to stay up to date on breaking news coverage

