Join Our Telegram channel to stay up to date on breaking news coverage
Bitcoin (BTC) Price Prediction – October 19, 2020
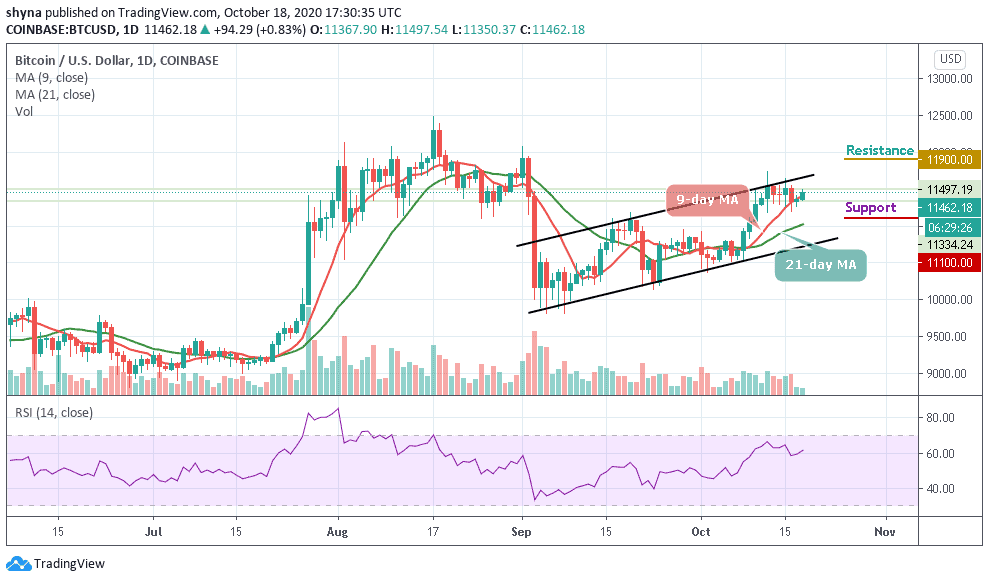
BTC/USD price broke the current price range between $11,200 and $11,440. Also, Bitcoin bulls broke the $11,500 resistance zone but could not sustain price above it. The Upside momentum is imminent if the bulls break the $11,500 resistance.
Resistance Levels: $10,000, $11,000, $12,000
Support Levels: $7,000, $6,000, $5,000
Yesterday, the bulls broke the resistance of the range-bound zone and resumed the upward move. The current uptrend is facing a barrier as the bulls find penetration difficult at the $11,500 resistance zone. On October 16, the king coin was repelled as it plunged to $11,200 support after an unsuccessful attempt to break the $11,500 resistance zone. Buyers are recouping again to retest the $11,500 resistance.
On the upside, a break above the resistance zone will propel BTC to pick up momentum to resume a fresh uptrend. Nevertheless, the bulls have retested the current resistance zone on three occasions but without a breakthrough. Usually, a resistance level becomes weaker after several retests. Eventually, if the bulls break the resistance zone, BTC will have an accelerated price movement on the upside. The coin will rally above the $11,800 resistance. Subsequently, the $12,000 overhead resistance will be retested or broken. The momentum will extend to the $12,400 resistance. However, if BTC price turns down from the overhead resistance, Bitcoin will be compelled to another range bound movement.
Bitcoin (BTC) Indicator Analysis
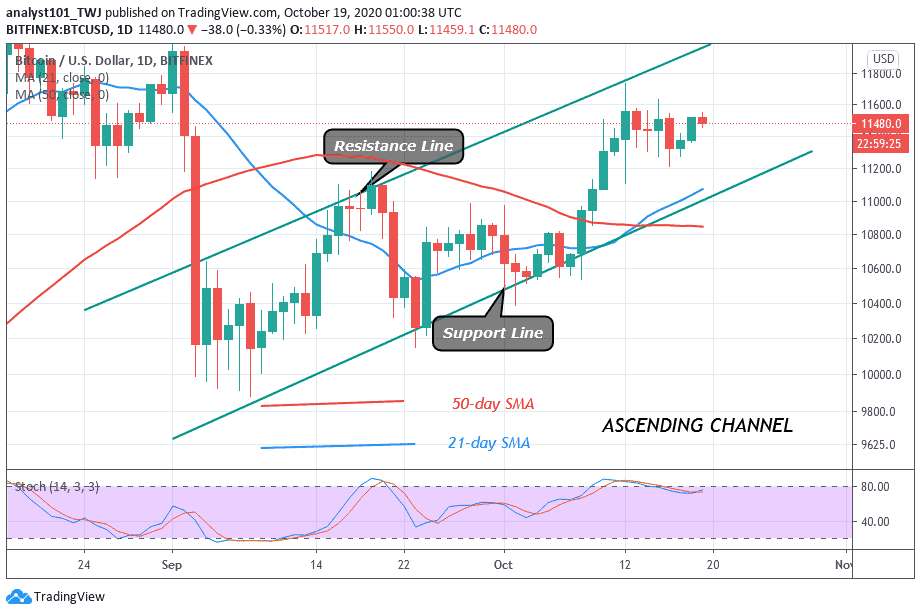
Bitcoin (BTC) is now in a bullish momentum as the coin is above the 75% range of the daily stochastic. BTC price will continue to rise as it is above the SMAs. Bitcoin has regained bullishness as the Relative Strength Index period 14 and the daily stochastic show price in the uptrend zone.
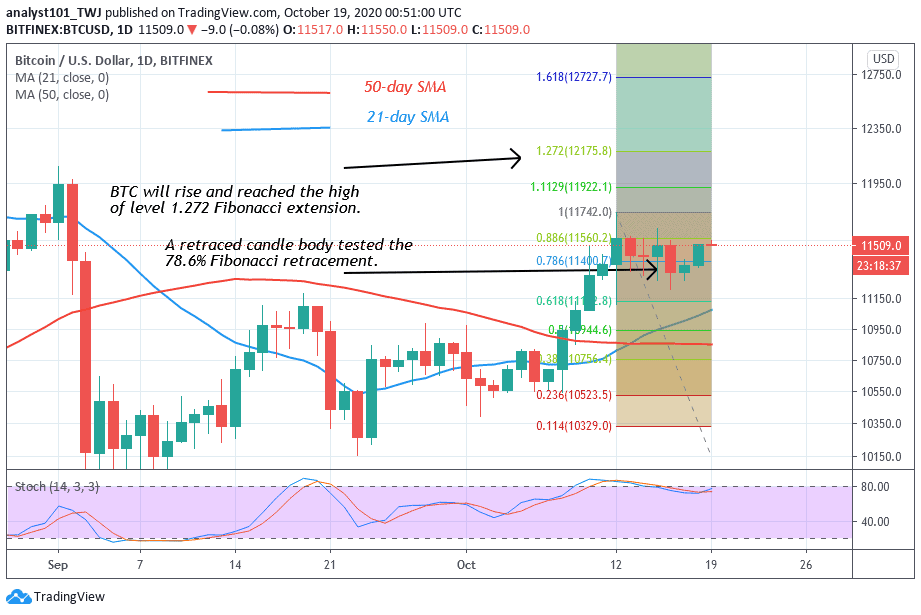
Meanwhile, the king coin is likely to break the current resistance at the $11,550 high. According to the Fibonacci tool, a break above this resistance will catapult the coin to retest the $12,000 overhead resistance. On October 12 uptrend, BTC was resisted, the retraced candle body tested the 78.6% Fibonacci retracement level. With this retracement, it implies that Bitcoin will rise and reach the 1.272 Fibonacci extension level. That is the market will reach the $12,175.80 high. At that price level, BTC will reverse and return to 78.6% Fibonacci retracement level where it originated.
Join Our Telegram channel to stay up to date on breaking news coverage