Join Our Telegram channel to stay up to date on breaking news coverage
ETH Price Prediction – October 17
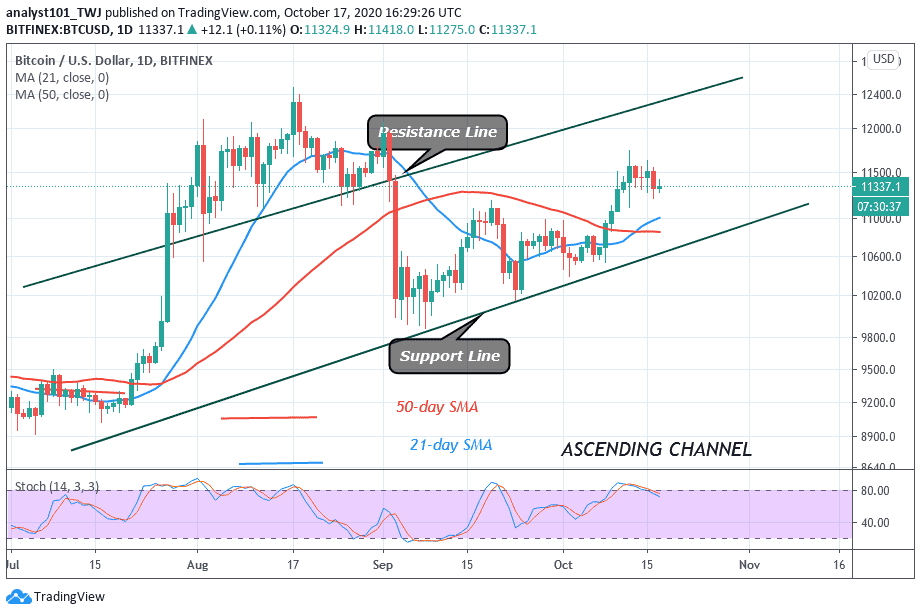
In the past few days, Ethereum surges from $334 to $395 and then drops to $363 today.
ETH/USD Market
Key Levels:
Resistance levels: $415, $425, $435
Support levels: $310, $300, $290
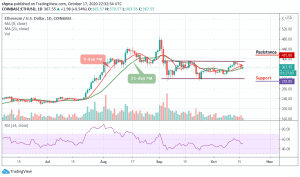
ETH/USD has been consolidating within the channel since last month. For now, the price of Ethereum is currently trading at $367.55 as it seen trading around the 9-day and 21-day moving average. At the opening of the market today, the daily chart shows that the price first went up to $370, where it met resistance and later fell to the $363 support level where it began to correct itself.
Where is ETH Price Going Next?
The technical indicator RSI (14) suggests that the bears may continue to remain in control as the signal line drops below 50-level. More so, if the Ethereum price dives below the moving averages, it could breakdown to the primary support at $340. For now, a sideways movement between $322 and $390 could be a welcomed move which may likely allow the buyers to forge another attack on $415, $425, and $435 resistance level in the coming sessions.
However, if the price drops below the $350 support, the coin is likely to locate the critical support at $330 which is a close support level for the bears. A bearish continuation could bring the market to $310, $290, and $280 support levels. Nevertheless, the trend keeps moving sideways as the market remains indecisive at the time of writing.
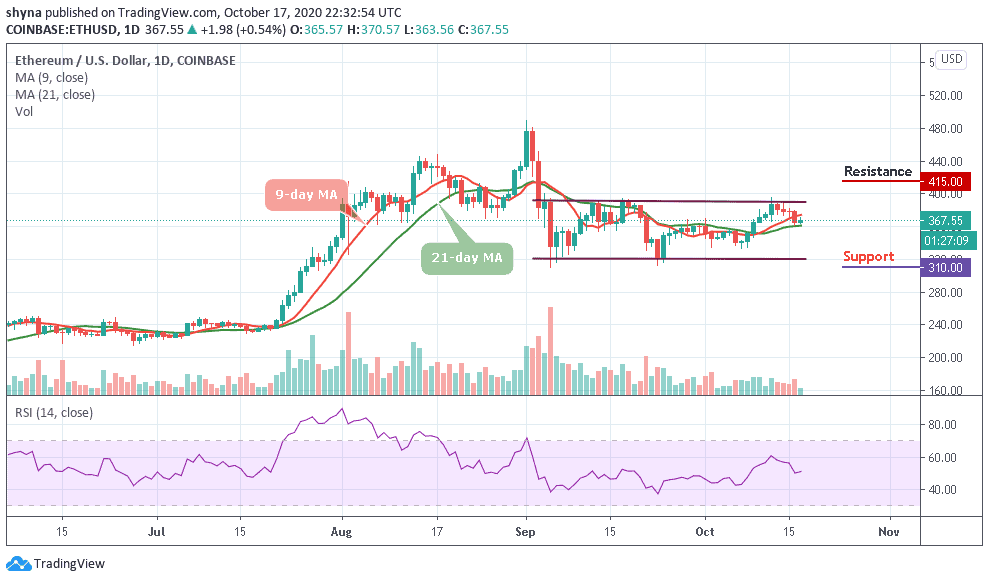
Comparing with Bitcoin, the recent price decline continues to place the Ethereum price in a downward trend after witnessing a bullish price action a few days ago but the price action is currently trading below the 9-day and 21-day moving averages. Looking at a long-term bear market, the 0.030 BTC, 0.028 BTC, and 0.026 BTC could provide further support levels for the next selling pressure.
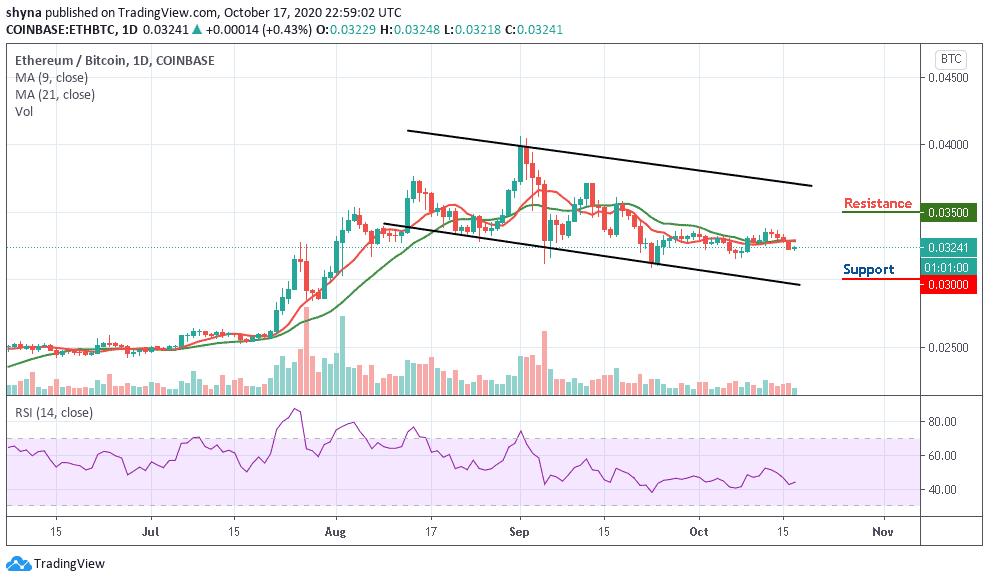
Moreover, between October 13 and today, the Ethereum price fell to the 0.032 BTC following a sudden rise in the downtrend. Now, the sellers may likely return to the market after a little indecisive appearance. However, if the 0.032 BTC can act as a solid line of defense against any further downtrend; buy pressure at 0.035 BTC, 0.037 BTC and 0.039 BTC resistance levels can be expected. The RSI (14) is currently on the negative side.
Join Our Telegram channel to stay up to date on breaking news coverage