Join Our Telegram channel to stay up to date on breaking news coverage
Bitcoin (BTC) Price Prediction – October 17, 2020
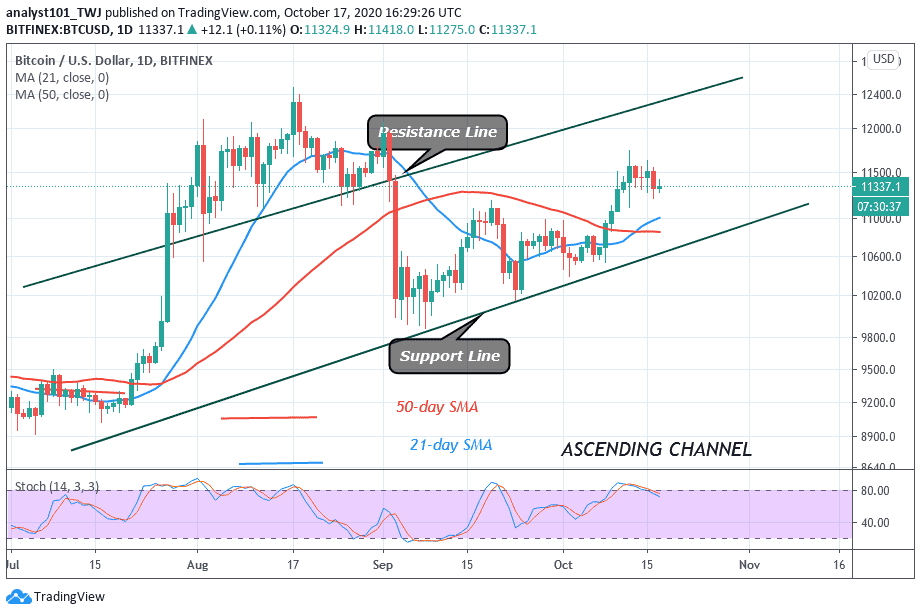
BTC/USD is currently in consolidation in the current tight range between $11,200 and $11,440. In the lower time frame, the price action is characterized by small body candlesticks called Doji and Spinning tops. These candlesticks describe the indecision between the bulls and the bears about the direction of the market.
Resistance Levels: $10,000, $11,000, $12,000
Support Levels: $7,000, $6,000, $5,000

On October 16, Bitcoin fell to a narrow price range between levels of $11,200 and $11,440. This consolidation becomes necessary because of the previous price action. On October 12 uptrend, the Bitcoin price reached a high of $11,740. Soon after the peak price, BTC resumed a downward move to the present range-bound zone. In the range-bound zone, the price will rise or fall through a breakout or breakdown. Analysts believe that the market will decline as bulls the bulls will buy the dips. Eventually, if a breakdown occurs, the market will reach a low of $11,000. On the upside, if a breakout occurs, the momentum will rally above the $11,800 high.
Bitcoin (BTC) Indicator Analysis
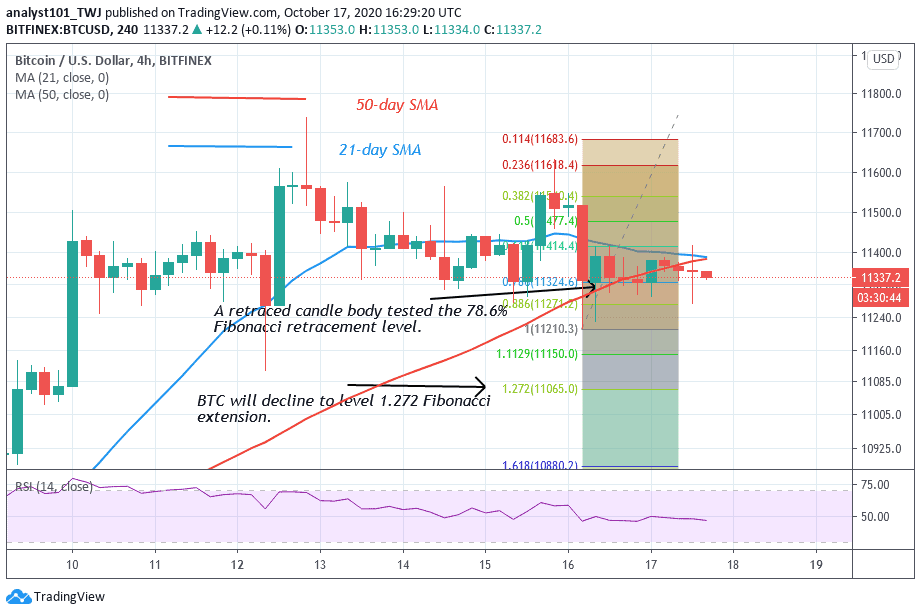
BTC price will rise as long as the price bars are sustained above the 21-day and 50-day SMAs. The moving averages have made a bullish crossover as the 21-day SMA crosses above the 50-day SMA. This gives a buy signal. Bitcoin is at level 49 of the Relative Strength Index period 14. It indicates that there is a balance between supply and demand.

Nevertheless, Bitcoin is still confined in the narrow price range. A price breakdown or breakout is imminent. A breakdown will only confirm the Fibonacci tool analysis. That is, the retraced candle body tested the 78.6% Fibonacci retracement level. The retracement indicates that Bitcoin will further decline to level 1.272 Fibonacci extension. This is the equivalent of an $11,065 low. The market will resume an upward move after falling to the previous low.
Join Our Telegram channel to stay up to date on breaking news coverage

