
Join Our Telegram channel to stay up to date on breaking news coverage
BCH Price Prediction – October 17
The Bitcoin Cash (BCH) retreats to test $241 support ahead of the breakout to $300.
BCH/USD Market
Key Levels:
Resistance levels: $260, $270, $280
Support levels: $225, $215, $205
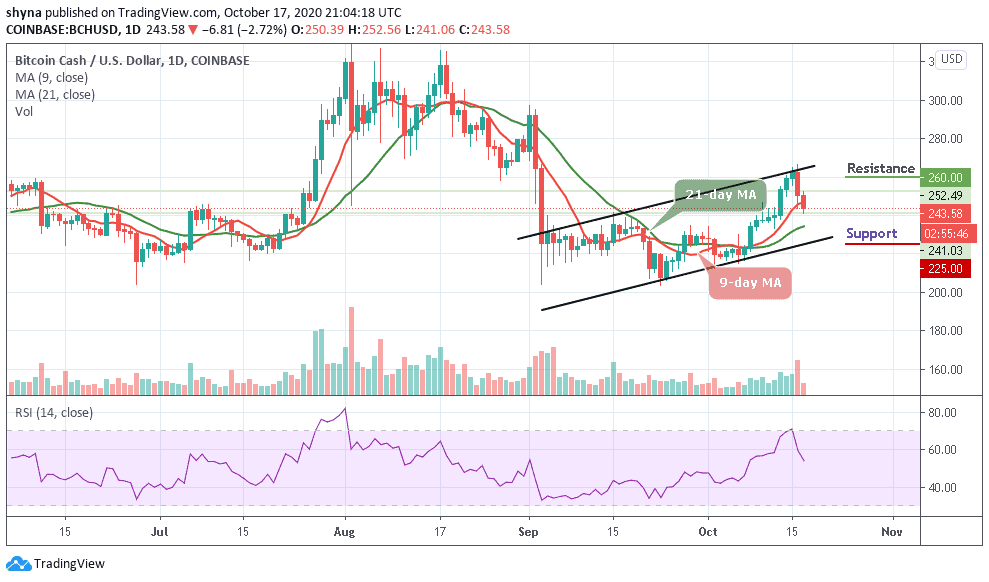
Despite maintaining a bullish movement for the past few days, it looks like BCH/USD is looking to slow down and settle around the $230 level. The market continues to follow the downtrend today, touching its lowest daily level at $241.06. However, the current movement of the coin in the market is below the normal expectations of traders.
Where is BCH Price Going Next?
BCH/USD is currently trading at $243; the daily chart shows that the coin is trading below the 9-day moving average within the ascending channel but yet to reach the 21-day MA. At the time of writing, the market price nosedive and remains below the 9-day moving average as it continues to issue a sell signal as the RSI (14) moves below the 55-level.
However, a minimum swing may likely push the market to a $230 level of support. Exceeding this level could take the bears to $225, $215, and $205 levels by crossing the lower trend line of the channel. Meanwhile, a high swing may likely take the bulls to a key resistance level of $250. Above this, the coin can possibly trigger a bullish rally which may take the price to $260, $270, and $280 resistance levels.
When compares with Bitcoin, the daily chart reveals that the bears are focusing on the downtrend. However, the recent negative signs reveal that the trend may continue to go down if the sellers are given a chance to continue to pump more pressure into the market.
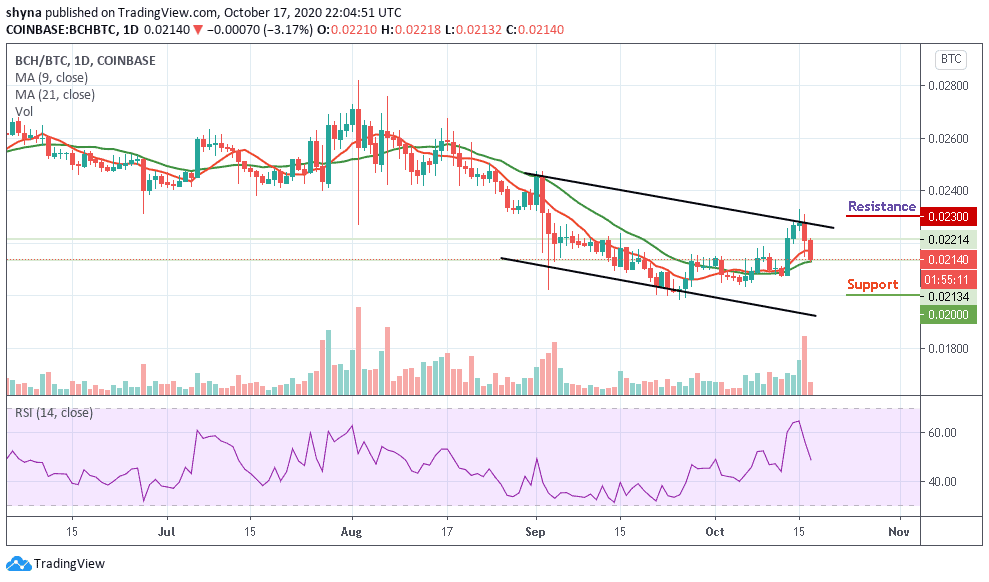
More so, as the RSI (14) signal line nosedives below 49-level, if the buyers can hold the support of 0.021 BTC, the market price may likely continue an upward movement, pushing further can take it to the resistance level of 0.023 BTC and 0.024 BTC but a retest could lower the price below the moving averages, which may likely push it towards the supports of 0.020 BTC and 0.019 BTC respectively.
Join Our Telegram channel to stay up to date on breaking news coverage
