Join Our Telegram channel to stay up to date on breaking news coverage
The EOS price prediction shows that EOS is beginning to restart the uptrend after trading below the moving averages for a while.
EOS Prediction Statistics Data:
- EOS price now – $0.54
- EOS market cap – $609.8 million
- EOS circulating supply – 1.1 billion
- EOS total supply – 1.1 billion
- EOS Coinmarketcap ranking – #49
EOS/USD Market
Key levels:
Resistance Levels: $0.65, $0.70, $0.75
Support Levels: $0.45, $0.40, $0.35

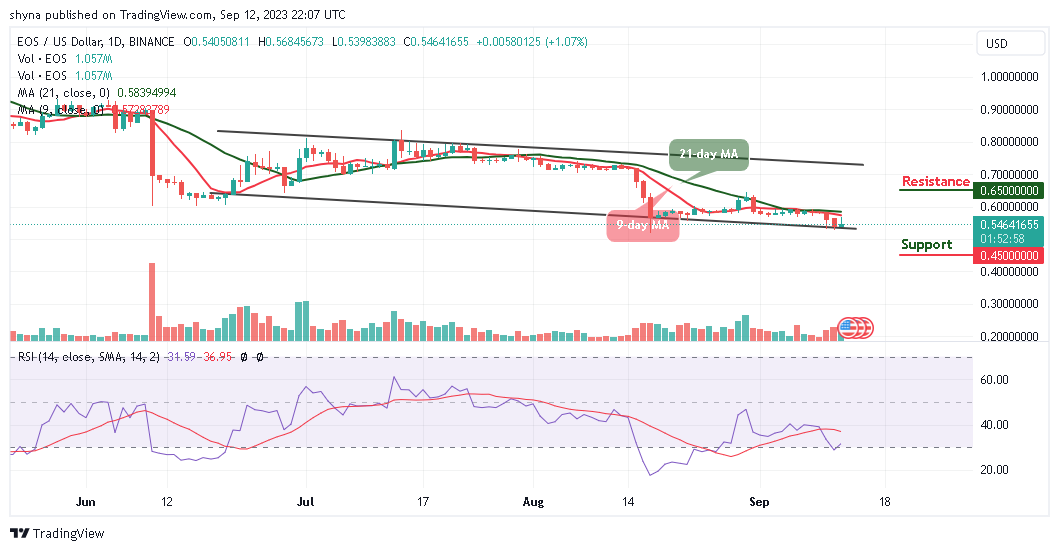
EOS/USD is trading bullishly today as the price touches the resistance level of $0.56 around the 9-day moving average. Meanwhile, a bullish cross above the 21-day moving average is needed to push the coin toward the upper boundary of the channel. However, traders should note that a consistent price increase within the channel may bring more buyers into the market.
EOS Price Prediction: Price May Begin to Break Higher
For the past few days, the EOS price has been hovering below the 9-day and 21-day moving averages. Therefore, EOS/USD is now looking forward to breaking above the moving averages. Meanwhile, the daily chart reveals that if the 9-day moving average crosses above the 21-day moving average, it could push the coin toward the resistance level of $0.60.
Nevertheless, the bears may take advantage of breaking below the lower boundary of the channel if the bulls fail to move the price upward. However, the technical indicator Relative Strength Index (14) is likely to cross above 35-level which could increase the bullish movement within the channel. Moreover, if the EOS price crosses above the moving averages, it could hit the resistance levels of $0.65, $0.70, and $0.75 but sliding below the channel may bring the price to the supports at $0.45, $0.40, and $0.35.
EOS/BTC Remains at the Downside
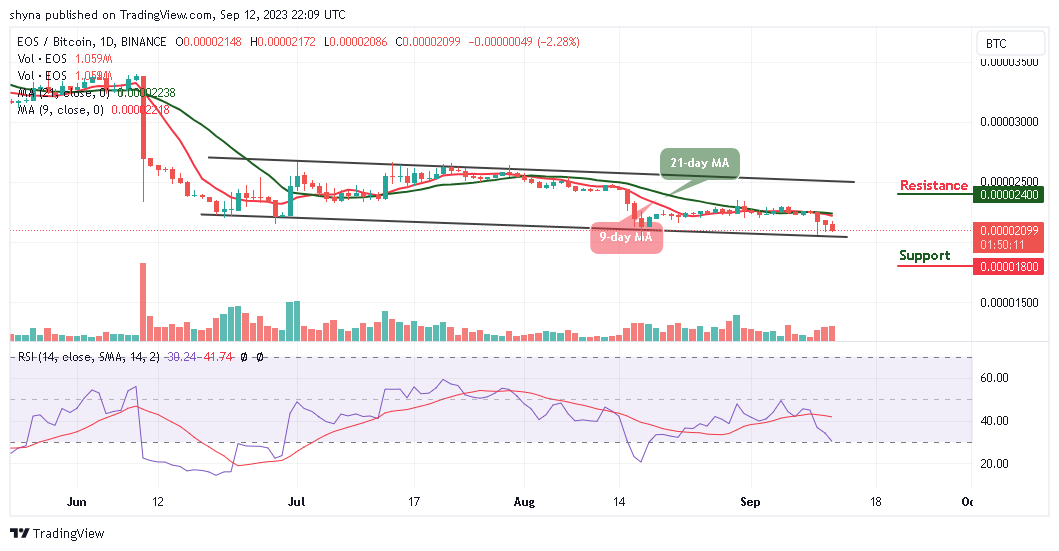
Against Bitcoin, the EOS price is hovering below the 9-day and 21-day moving averages. However, intraday trading ranges as the coin moves to cross below the lower boundary of the channel, which could reach the support level at 1800 SAT and below.

On the contrary, if the buyers push the market to the north, traders can expect a spike above the moving averages, breaking above this barrier could hit the resistance at 2400 SAT and above. Meanwhile, the technical indicator Relative Strength Index (14) may cross below the 30-level, suggesting more bearish signals into the market.
EOS Alternatives
At the time of writing, the EOS price movement is in the hands of bulls as a slight price increase is seen for the coin. However, it is likely for the coin to spike to the upside, and a breakout above the moving averages may drive it toward the upper boundary of the channel.
However, amidst the decline of some popular tokens, the Wall Street Memes token continues to be rated a “buy” because of its attractively low presale price, resulting in gains of over $25 million. Meanwhile, the optimal strategy is to secure some tokens now before their price experiences a rapid ascent.
CoinCodex - Our Recommended Crypto Research Platform
- Live Cryptocurrency Prices for Over 20,000 Coins
- Crypto Price Analysis with Popular Technical Indicators
- Crypto Price Predictions with Short and Long-Term Charts
- Historical Crypto Market Data Dating to 2010
- Crypto Portfolio, Profit Calculator, and Other Investment Tools
Join Our Telegram channel to stay up to date on breaking news coverage


